
Stock analysis without a prior knowledge of the stock market basics can be complicated. Investors rely on online tools, platforms, brokers, and advisors to enhance their investment process. As a beginner, stock research can sound intimidating. Now, with this blog, you will be a step closer to improving your investment knowledge. In the next five minutes, you will read through a ‘How to Research Stocks: A Beginner’s Step-by-Step Guide’ which will help you understand the 6 crucial steps involved in researching stocks the right way.
How to Research Stocks
Assessing an investment opportunity involves understanding if your financial and personal goals align with the stock’s objective. Explore the sectors and industries that you are interested in investing in. Then, conducting in-depth due diligence is essential. Investors often perceive stock research as a complicated, tedious, and technical process. Two major components of stock research include: fundamental and technical analysis.
Fundamental analysis evaluates a company’s financial position, key metrics, and qualitative comparisons. Technical analysis utilises statistical techniques on stock charts and patterns to determine future price movements or trends.
Let’s check out the 6 steps of researching stocks below:
Step 1: Understand the Business & Revenue Mode
Say you have a stock in mind. The prerequisite is to understand the business and revenue stream. Learn the company’s line of business and operations, its revenue generation, major contributors to revenue, client base, etc. These details are easily available on the company’s official website.
For example, some stocks and their major revenue sources include:
| Stock | Major Revenue Source | Contribution to total revenue (FY25) |
| Nestle India | Milk Products & Nutrition | 40.65% |
| Lloyds Metals and Energy | Mining | 80.36% |
| 3M India | Safety & Industrial | 32% |
Read about the business activities they participate in. Evaluate any news or information available on their website.
Step 2: Review Financial Statements & Ratios
The next step is to review the company’s financial statements and key ratios. These provide useful insights into the company’s operational efficiency, management, and profitability. Analysing financial statements is key to determining the company’s growth potential. Ratios like current ratio, return on equity, debt-to-equity ratio, or profit margins estimate the financial health of the company.
For example, Nykaa’s long-term debt-to-equity ratio for FY25 was 0.08, which shows a stable leveraged position. It suggests that Nykaa’s dependence on borrowed funds is low.
Step 3: Analyse Price Charts & Historical Trends
Next, examine the price charts and technical indicators to understand the stock’s price pattern. This helps in understanding the price history and long-term trends of the stock. Essentially, study how the stock reacts to different market conditions. Whether you want to predict the price movement or identify possible trend reversals, technical tools can prove to be helpful while researching stocks.
One of the basic tools of technical analysis is the moving average. It is used to smooth out historical price data to identify the direction of current trends. When the stock price crosses the moving average line, it potentially means an uptrend.
Step 4: Build a Watchlist & Monitor Regularly
You don’t have to invest right away. Keep an eye on the stock to mark its movements and understand the potential of the stock. Add this stock to your watchlist. This watchlist feature is available across various stock market platforms. You can also add multiple stocks at a time to study the potential entry points.
Step 5: Look Beyond the Numbers
Your decision to invest should not only be based on the stock’s individual characteristics, but also on the overall industrial landscape. Industrial analysis gives you a comprehensive overview of the business potential and its projected trajectory.
Companies release their annual reports, management commentary, and future projections regularly. Any change or fluctuation in their objectives or operations could additionally help you evaluate if the stock is a right fit for your portfolio.
For instance, Reliance began in 1966 as a textile trading company, but today it spans everything from oil refineries to telecom. Such drastic shifts in core operations remind investors to pause and reassess whether the company still ticks its investment checklist.
Step 6: Read Expert Commentary & Analyst Insights
Market analysts release their expert commentary and analytical insights on stocks. These generally include opinions on the stock’s potential, current buy or sell recommendations, and risks associated with the stock. Reading through these insights can develop a strong opinion of your own. However, always consider multiple opinions rather than relying on one.
For example, on 16th September, The Times of India published recommendations from an expert, Mr. Somil Mehta, Head – Alternate Research, Mirae Asset Sharekhan, to consider buying stocks like Prestige and GMR Airport within a suggested price range.
But, do note that these recommendations and opinions are subjective. Hence, this is only to be considered supplementally over your research.
Best Stock Market Research Platform
Numerous free stock research tools and platforms are available to make your stock research efficient. These tools provide real-time data analysis, expert opinions, fundamental & technical analysis tools, trading guides, and more to save time and effort. In fact, as Artificial Intelligence is evolving, all these tools are becoming increasingly popular in stock market analysis.
Stoxo– India’s first AI-based stock market research and trading platform provides users with stock market analysis in no time. See a glimpse of how this works.

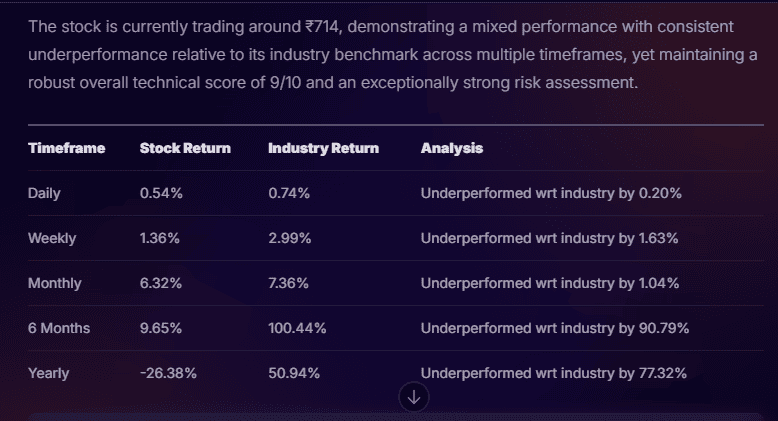
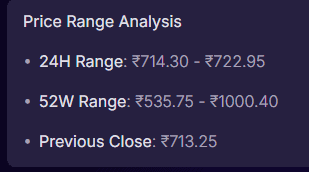
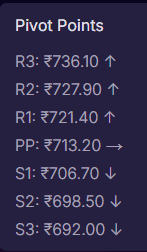
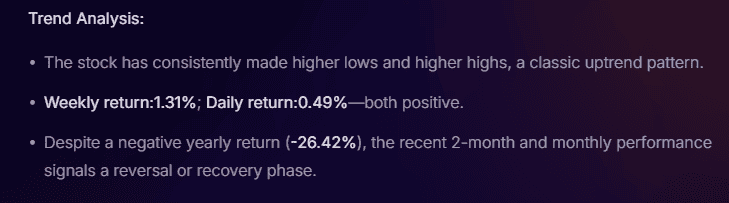
Stoxo instantly gives a thorough analysis of the stock, covering price range analysis, pivot points, trend analysis, market sentiment, and more. This will save time and help you fast-track your investment decisions.
Conclusion
Stock research is a long and complex process that requires careful analysis. Simplifying the process by following the how to research stocks step-by-step guide above can help you analyse efficiently. The stock market is volatile; therefore, prior due diligence is a must. With progressive AI-enabled platforms like Stoxo, your analysis can be time-efficient, reliable, and optimal.
FAQs
The best way to start researching stocks is to follow a simple six-step guide for beginners. The steps include: Understanding the business and revenue model, reviewing its financial statement and ratios, analysing price charts and historical trends of the stock, building & monitoring a watchlist, considering more than just numbers, and following expert advice.
Beginners can review the company’s income statement, balance sheet, and cash flow statements to determine its operational efficiency, profitability, revenue models, and cash movements. This helps in understanding the financial health and stability of the company.
EDGAR – Electronic Data Gathering, Analysis, and Retrieval is an online database in the United States that makes public company filings in the US fully accessible to the public. This system is not available for Indian companies yet. The platform, however, is open to global investors too. You can browse through the EDGAR website to access filings of any public companies in the US.
Price charts are important in conducting the technical analysis portion of stock research. These price charts help in analysing price trends, movements, and entry-exit points. Understanding price charts can help in predicting future price movements and reactions to market dynamics.
Before investing in a stock, it is important to regularly monitor and track its performance. You can estimate potential entry and exit prices while also determining the stock’s future potential.

Leave a Comment