You have 4000+ listed equities across NSE and BSE as of September 2025. Without a proper framework, the choice feels endless and riskier. That is why you turn to fundamental analysis for a calculated move. In this discussion, let us discuss one part of it—company analysis.
Fundamental analysis is a broader term that analyses micro and macro factors to understand whether the stock is undervalued or overvalued against its fair worth. Company analysis is a component within the fundamental analysis umbrella.
What is Company Analysis in Fundamental Analysis?
Company analysis in fundamental analysis, combines measurable data with qualitative insight, giving market participants a reasoned view of whether the stock mirrors its intrinsic value. The company analysis, as the name suggests, analyses specifically on the financial and qualitative foundations of a single company.
Importance of Company Analysis
The importance of company analysis in stock market, becomes evident in several dimensions:
- Financial statements outline the operational health and highlight areas of strength or weakness
- Ratios tells about the performance trends through profitability, liquidity and leverage
- The analysis can reveal vulnerabilities that might threaten profitability or stability
- Understanding business engines and sectoral forces links external dynamics with earning power
- Comparing intrinsic worth with the prevailing market price assists in forming a balanced assessment
Key Components of Company Analysis
The steps in company analysis for investing typically covers distinct areas
- Financial Profile: Checks company’s financial health including turnover, profitability, liquidity position and leverage ratios
- Market Positioning: Sector presence, competitive stance and capacity to defend or expand market territory
- Leadership: Executive team, leadership calibre and consistency in implementing long-term strategy
- Growth Outlook: Expansion plans, product innovation and opportunities for fresh market access
- Governance Practices: Governance standards showing transparency, accountability and protection of shareholder interests
How to Do Company Analysis (Step by Step)
Now let us understand the step by step process of how to do company analysis in fundamental analysis. As noted earlier, it involves examining several dimensions of a business. Each step adds a specific angle, when all combined, it builds a full picture of the stock’s standing.
Step 1. Review the Company’s Position in Its Industry
First understand where the company stands within its industry. Look at broader indicators like market capitalisation and market share, to understand its relative standing against its peers.
Step 2. Examine the Business Model and Operations
The next step gets firmographic. Look closely at the basic data to understand the company’s core activities. Assess its products or services, target customers, distribution channels, supply chain and partnerships. This helps you judge whether the company runs efficiently and whether its model has long-term viability.
Step 3. Analyse the Financials
As we understand the company’s operations, attention travels to the financial statement analysis in fundamental analysis. Check the company’s core financial documents. Take note of metrics like revenue growth, profitability, debt levels and liquidity. Plus, compare these figures with peers, to get perspective on financial strength.
Step 4. Assess Management and Governance
Next look at who is holding it on the top. Hence look at the leadership team’s experience, decision-making and track record. Moreover, review the company’s governance setup, its policies and commitment to transparency. Since good management and sound governance are key indicators of long-term stability.
Step 5. Conduct a SWOT Analysis
In this step, turn the above insights into the company’s strengths, weaknesses, opportunities & threats. As it helps in presenting the holistic view of the company.
You can fast-track this process with Stoxo, a stock market AI that delivers real-time insights.
For example, simply prompt “Provide a detailed company analysis of Reliance Industries. Cover its position in the industry, business model, operations, financials, management, SWOT analysis, and strategic insights. ” and it will generate a comprehensive review covering all key elements from stock score to SWOT analysis, that assists you in decision making.

Core Financial Documents for Company Analysis
When you evaluate a company, you cannot rely on surface level information. Therefore, look closer into the main financial statements that actually show how the business truly performs behind the curtains.
- Balance Sheet: The company’s assets, liabilities and shareholder equity at a specific date will be recorded here. It helps to understand the solvency, liquidity position and reliance on borrowings. For example, take the debt-to-equity ratio. So, if your company keeps leverage under control, it means you preserve flexibility in uncertain markets.
- Income Statement: The profit and loss account outlines turnover, expenditure and net results over time. It reveals efficiency in cost control and the ability to deliver surpluses. Some of the key indicators you should look at are margins, return on equity and earnings per share. Hence if a firm is showing steady consistent increase in these main indicators, it reflects durable competitiveness and prudent management.
- Cash Flow Statement: This report traces movements of money through operating, investing, and financing activities. It shows whether reported earnings translate into actual inflows. Strong cash generation from core activity, coupled with balanced reinvestment, indicates a model that can sustain growth without leaning heavily on debt.
Financial Performance Metrics
There are many indicators to give the actual view of financial health, but here are some ratios & metrics to start with.
Valuation Ratios
These valuation ratios in company analysis place how the overall market values a company in context.
- Price-to-Earnings reflects what participants pay for each unit of profit.
- Price-to-Sales links market price with top-line strength.
- EV/EBITDA weighs overall enterprise worth against operating surplus.
Profitability and Stability
Here the focus is on efficiency and balance sheet discipline.
- Return on Equity highlights how effectively shareholder capital is employed.
- Current Ratio captures the ability to settle near-term commitments.
- Debt-to-Equity reveals leverage, while margins map cost discipline and profit quality.
Growth-Adjusted Valuation
The Price/Earnings-to-Growth or PEG ratio adjusts valuation for expected earnings expansion. A reading above 1 can hint at overpricing, while below one often suggests relative underpricing.
Strategic and Operational Analysis
When you do the company analysis, you cannot stop at the numbers. You also need to examine direction and execution provides perspective on an enterprise’s footing today and its ability to adjust for the future.
- SWOT Review: This framework balances positives such as scale, reputation or efficiency against gaps including high costs or reliance on limited products. It also identifies external prospects, for example favourable policy shifts, alongside risks like new competitors or fragile supply chains.
- VRIO Approach: The VRIO lens considers whether capabilities are valuable, scarce, hard to copy and supported by structure. Meeting all conditions often results in durable strength, as when firms control patented technology or cultivate expertise that others cannot easily secure.
- Management Insights: Leadership disclosures reveal more than the numbers. Reports outline current progress, strategy, risks, and direction. Studying them helps assess vision, credibility, and capacity to deliver.
Where to find company analysis reports?
Generally one needs to rely on exchange filings, corporate briefings, and brokerage commentaries to do the company analysis. These records are credible, though analysing them can be slow and fragmented.
Stoxo streamlines the process. It generates company analysis instantly. Moreover highlights unique insights that you might have overlooked in manually analysing traditional sources.
What are the limitations of company analysis?
- Reliance on historical records narrows perspective to past events, offering little certainty about what may unfold next.
- Forward estimates rest on judgement, leaving inferences open to distortion or misplaced confidence.
- Transparency varies among enterprises, limiting visibility and creating uneven ground for evaluation.
- Sudden disruptions through regulation, economic turbulence, or technological change can swiftly undermine earlier findings.
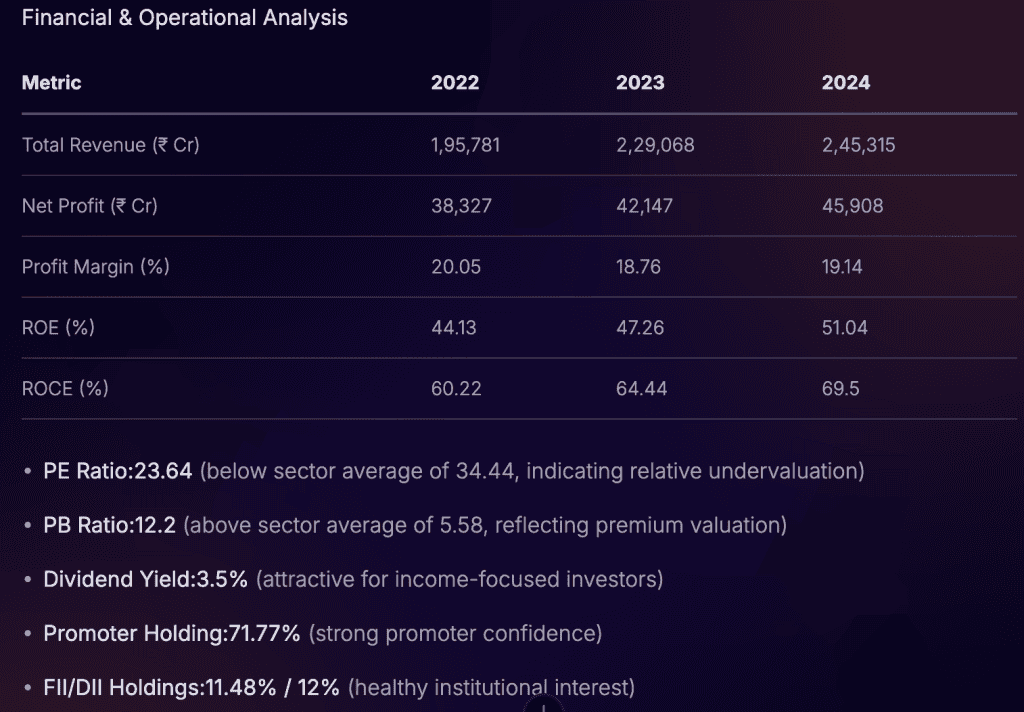
Practical Example
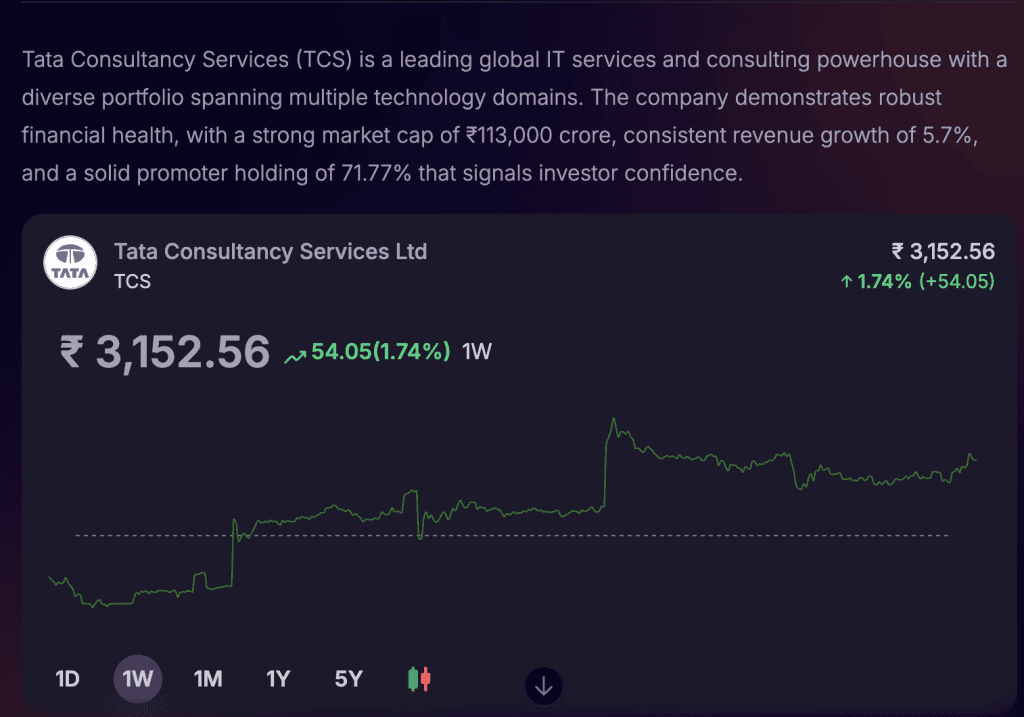
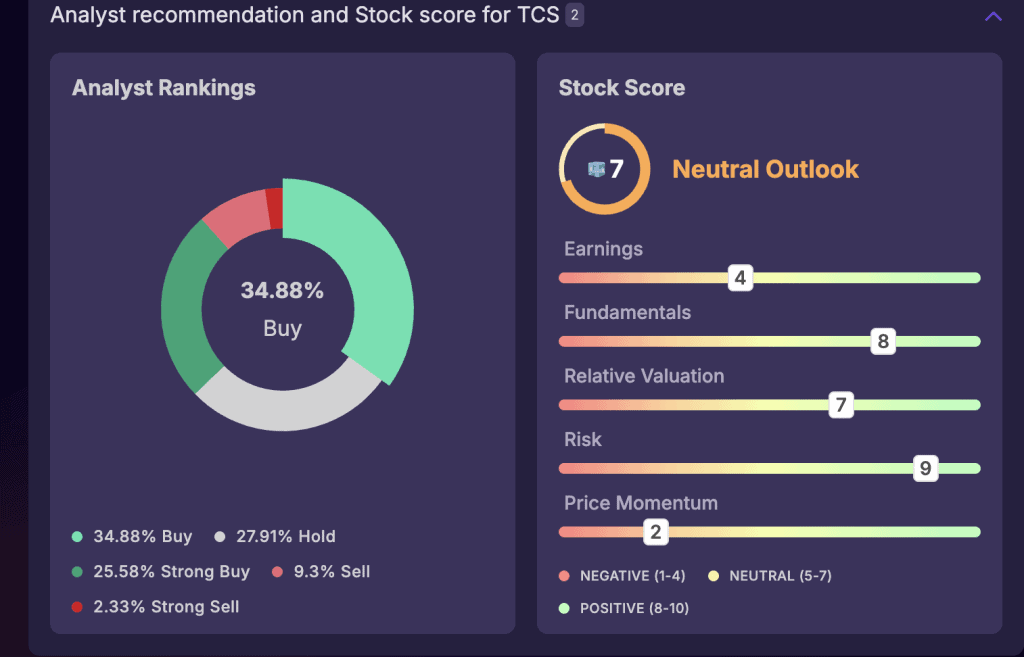
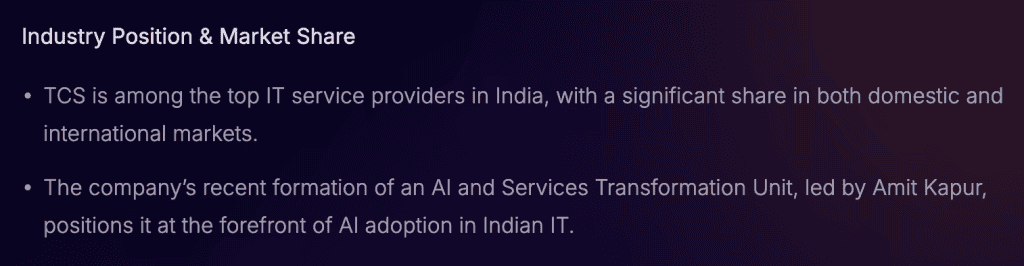
Now let us ask Stoxo to generate a company analysis of TCS, covering all the important points as discussed above. Within seconds, the platform compiles the following structured report that highlights each of these dimensions along with the analyst view with clarity. Here is an example of company analysis in stock market:

Is company analysis the same as fundamental analysis?
As noted earlier, the two are related but not identical. Fundamental analysis takes a wider view, covering economies and industries. Company analysis is the subset. It narrows to a single enterprise, its health and direction.
Conclusion
A well-executed company analysis sharpens your perspective on an enterprise’s true position. Combined with broader fundamental study, it equips you to take decisions with greater clarity and conviction.
FAQ
It looks at a single enterprise in detail. The focus is on financial records, leadership quality, and long-term direction. It helps you form a view of the strength and vulnerability of the firm in the analysis.
It gives clarity on how a business is really performing. Moreover, it helps you see strengths, gaps, and the ability to adapt. This makes you weigh risks before committing capital.
You look at how the business model works in practice. Next, you study the financials to test resilience. Then you assess leadership to judge direction and stability. Finally, you bring it together through a SWOT view.
You measure valuation through P/E, P/S and EV/EBITDA. Profitability and balance sheet discipline show in ROE, margins, current ratio and debt levels. Growth perspective often comes from the PEG ratio.
One looks inward at a single firm’s strengths, numbers, and governance. The other scans the wider market forces, competition, and sector trends.

Leave a Comment