
The Indian stock markets faced one of their worst crashes in 2020 while the world remained locked down in their houses to safeguard themselves from the COVID-19 virus. Sensex dropped from 41,000 points to 25,981(a 36% fall) in March 2020 as global markets suffered from uncertainties. These stock market crashes instill a sense of panic amongst investors, leading to aggressive selling of stocks. What if investors could predict stock market crashes? Yes, it’s possible.
This blog uncovers the unique features of stock market crash prediction, including stock market crash signals, technical patterns, AI models to be used, and more.
What does “stock market crash prediction” mean?
A stock market crash prediction involves potentially foreseeing any sharp fall or a sudden drop in the stock market prices of a broad market index beforehand. The prediction requires the use of various tools, like technical analysis tools, fundamental analysis tools, machine learning models, and more.
While there is no official definition to confirm, a stock market crash is generally classified as a sudden drop in stock market indices within days, shaking investor confidence and potentially incurring losses. Predicting a stock market crash entails forecasting the crash to eliminate the panic, by working as an appropriate risk assessment tool for investors.
Historical crash models and theories (e.g., Prechter’s Elliott Wave)
Let’s examine three historical crash models and theories that have guided investors with stock market predictions.
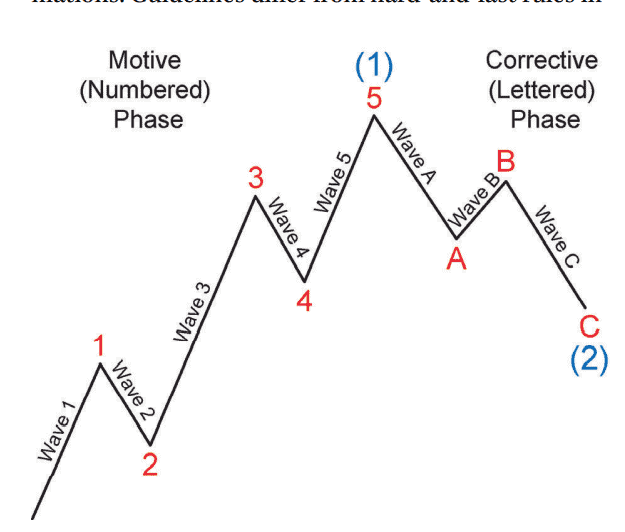
- Prechter’s Elliott Wave Theory: Coined by R.N. Elliott in the 1930s and popularised by Robert Prechter in the 1970s, the Elliott Wave Crash Predictions Theory suggests that stock market movements follow an identifiable, repetitive pattern known as waves. In an uptrend, the waves are called motive waves, while in a downtrend, these are called corrective waves. These waves are used to signal potential market crashes by identifying turning points and market trends.
- Log-Periodic Power Log Model (LPPL Model): The LPPL is based on mathematics, economics, behavioural finance, and physics to speculate on financial bubbles before a crash. They do so by estimating faster-than-expected growth and increasing oscillations that are often succeeded by a market crash.
- Machine learning crash models: These models apply machine learning algorithms to identify non-linear patterns that often precede market crashes. We will cover this in more detail later in this blog.
Technical indicators used for crash signals (Hindenburg Omen, co-movement metrics)
Technical indicators are widely used to signal potential concerns, risks, or warning signs of market crash. Let’s have a look at the metrics that are most commonly used:
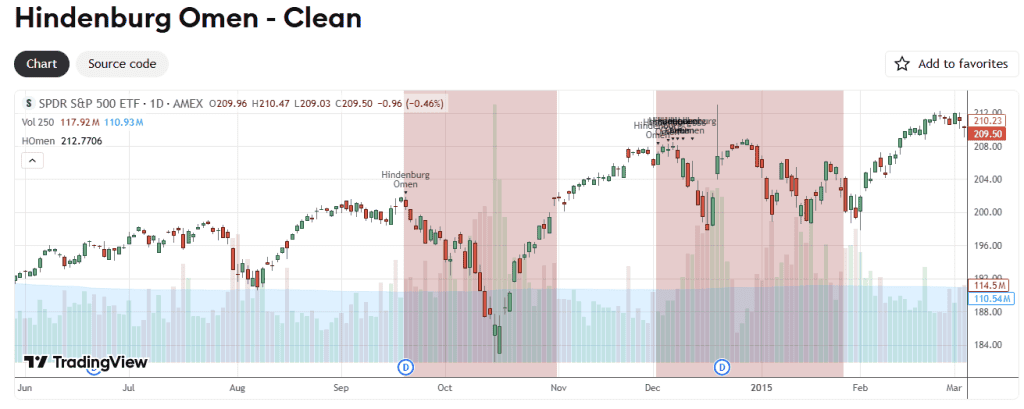
- Hindenburg Omen is a technical indicator designed to predict stock market crashes by analysing instabilities in an ongoing bull market. Certain factors work as triggers to indicate a possibility of a market crash or decline. Hindenburg omen explained by these factors:
| Trigger Condition | Interpretation |
| Many stocks simultaneously reach new 52-week highs and lows (typically >2.2% of total issues). | Indicates conflicting market sentiment- suggesting internal instability. |
| The number of new highs is not more than twice the number of new lows. | Signals weakening market breadth, as gains are not broadly supported. |
| The overall market index is in an uptrend (positive 50-day or 10-week moving average). | Suggests the signal occurs during a rising market, heightening the risk of reversal. |
| The McClellan Oscillator is negative. | Reflects declining market momentum and underlying weakness in advancing stocks. |
| Signal remains active for 30 trading days. | The market remains vulnerable to a correction during this period. |
- Co-movement metrics involve quantifying correlation among assets during market instability. As the co-movement in stocks or assets increases, it is often considered a signal of a stock market crash. This signifies rising systemic risk and investor panic. These metrics can capture herding behaviour that tends to occur before a market event.
For example, during the commencement of the 2008 Financial crisis, the co-movement amongst all global markets surged rapidly, which indicated that most markets were reacting identically. This signaled the systematic risk and herding behavior.
Economic and sentiment-based warning signs (Buffett Indicator, sentiment, valuations)
Economic and sentiment-based indicators gauge the overall market sentiment and reaction to price movements. These serve as warning signals for investors. Some commonly used macro indicators in this context include:
- Buffett Indicator is a long-term valuation indicator used by experts and investors to serve as a yardstick for stocks’ under- or overvaluation. It is calculated by dividing the total market capitalisation of the United States’ stock market by its total GDP. A figure of 100% implies that the market is fairly valued, more than 100% signifies the market is overvalued, and less than 100% indicates undervaluation.
Thus, a high Buffett indicator often indicates a possibility of a market crash, suggesting a reduction in future returns. Let’s have a look at the current Buffett Indicator:
| Indicator | Interpretation |
| 217 | Markets a over-expensive |
- Market sentiment: Investors often display extreme sentiments to complement or contradict market movements that can showcase the direction of the markets. Volatility Index (VIX) is a real-time market indicator that evaluates investors’ sentiment. These tend to spike before market crashes.
- Valuation metrics: Investors often rely on simple valuation metrics such as Price-to-Earnings ratio, Price-to-Book Value ratios, and others to assess overvaluation and undervaluation in the stock market. These metrics can also prove to be foundational in predicting stock market crashes.
AI & machine learning crash forecasting
Risk assessment can seem daunting to investors who do not have the technical know-how. That’s where Artificial Intelligence (AI) steps in. AI is increasingly being used to predict stock market crashes with the help of machine learning and algorithms. Through AI and machine learning, vast datasets can be analysed within minutes. These tools are also highly efficient in picking up on warning signs that a normal investor may miss.
Support Vector Machines and Deep Learning algorithms are typically used to study the non-linear relationship between different variables. These models interpret data in real-time and spot trends and risks in minutes, saving investors time and improving accuracy.
Tools such as Stoxo by Stockgro are popular AI tools that can help with analysis of stock market crash prediction, stock recommendations by AI, and more.
Case studies & notable forecasts (Harry Dent, Marc Chaikin, Robert Kiyosaki, Evercore’s 15% pullback warning)
Listed below are a few prominent historical stock market predictions that were forecasted correctly:
| Prediction made by | Prediction/Risk assessment analysis |
| Economist Harry Dent | Japanese Asset Bubble 1989 |
| Marc Chaikin, Founder of Chaikin Analytics | 2022 bear market, 2020 Covid crash bubble |
| Robert Kiyosaki, personal finance author | 2008 Global financial crisis |
| Evercore ISI analytics | Evercore warns investors of a potential 7-15% drop in the market in 2025. |
Limitations & false alarms: Why crashes are hard to time
Predicting stock market crashes may not be so simple. Certain limitations that cannot be ignored:
- Rare phenomenon: Crashes in the stock market are not a regular phenomenon; instead, they are a rare phenomenon. They occur when the market witnesses a non-linear relationship between different variables that cause a commotion. This makes these events difficult to predict.
- Data imbalance: Datasets of different stock market crashes belong to different timeframes, subject to distinct factors and variables. This may affect the accountability of these datasets.
- False alarms are common: These stock market prediction models may predict wrongly, resulting in false alarms that never materialise.
How to prepare your portfolio (risk management, diversifying strategies)
You can add a layer of protection to your portfolio by following these steps:
- Do not rely on one asset: Just as the famous stock market saying ‘Don’t put all your eggs in one basket’ suggests, you should always diversify your portfolio and spread investment in different asset classes such as stocks, bonds, mutual funds, etc.
- Diversification across geographies and sectors: Diversify your portfolio across different sectors and geographies to eliminate any regional concentration risk.
- Rebalance: Rebalance your portfolio regularly and keep monitoring stock market updates.
Conclusion
It is impossible to precisely predict stock market crashes. However, some tools and indicators like Hindeburg Omen, Buffet Indicators, Elliott Wave theory, etc, can help provide a base for accurate forecasting.
FAQs
Stock market crashes can be predicted using models and tools that are coined by experts. Machine learning models are widely used for predicting stock market crashes. Other indicators like Hindenburg Omen, Co-movement of variables, and Buffet Indicator are also amongst the popular tools for predicting stock market crashes.
Best indicators of a stock market crash include the Hindenburg Omen, co-movement metrics, and Buffet indicators, amongst others.
Economists like Harry Dent have given mixed reviews on certain stock market crash predictions. While Dent correctly anticipated some major events like the Japanese bubble burst in 1989 and the dot-com crash in 2000, many of his recent calls have been off-mark, with markets often defying his bearish forecasts and continuing to rally.
AI tools and machine learning algorithms serve as great stock market crash predictors. They use deep learning models and support vector machines to analyse vast datasets within minutes. They help in signalling warning signs for stock market crashes.
Signals like the Buffett Indicator help investors understand if the stock market is overvalued or undervalued. Even valuation metrics are used to determine the stock market’s valuation.
To protect your portfolio from a stock market crash, you should follow risk management strategies, including diversification of the portfolio across asset classes, geographies, and sectors.
Stock market crash predictions often fail due to the lack of accuracy in datasets, false alarms, and rumours.
Stock market crash prediction refers to analysing data and indicators to forecast sudden, large declines in market value caused by panic selling or economic instability.

Leave a Comment