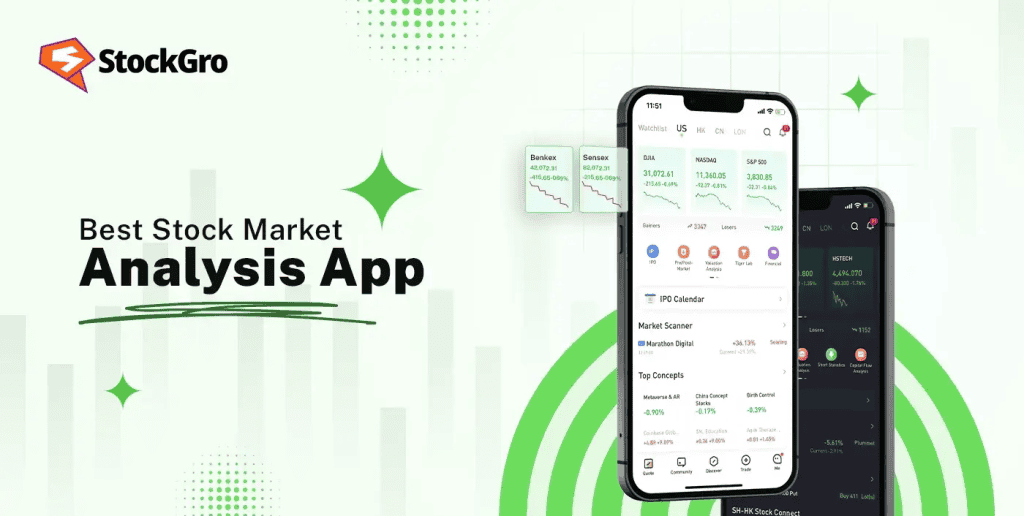
Best 5 Stock Market Analysis App
Choosing the right app depends on whether you’re a beginner who wants things explained or an active trader who just needs raw data and fast charts. For a deeper dive into what stock market analysis involves before picking your tools, that’s worth reading first. But here’s the short version of what’s worth downloading right now.
1. StockGro Stoxo Built for Indian retail investors who want analysis and education in the same place. Stoxo gives you AI-powered stock scores, peer comparisons, and fundamental breakdowns in plain language. You don’t need to know what P/E means beforehand the app explains why a number matters, not just what it is. It also has virtual trading, which makes it the easiest entry point for someone who’s never analysed a stock before.
2. TradingView The charting app that serious technical traders end up on. Customisable indicators, multi-timeframe analysis, and a social community where people share live trade setups. The free version limits you to three indicators per chart, but honestly that’s plenty for most retail traders. Works beautifully on mobile once you get past the initial learning curve of the interface.
3. Moneycontrol Still the go-to for Indian market news, earnings updates, and fundamental data. The app gives you detailed financials for every listed company revenue trends, profit margins, shareholding patterns, quarterly results. Not the prettiest interface, but for looking up numbers quickly during a trading day, nothing in India beats the speed and depth of data.
4. Tickertape Screeners are where this app shines. You can filter the entire NSE universe by dozens of parameters P/E ratio, debt levels, promoter holding, return on equity, dividend yield and save custom screens that update in real time. It also has a “match score” feature that rates how well a stock fits your stated investment criteria. Genuinely useful for long-term investors building watchlists.
5. Investing.com The broadest coverage of any free app. Indian stocks, US markets, commodities, forex, economic calendars, technical analysis summaries everything in one place. It gets cluttered with ads, which is frustrating, but the sheer range of data across markets makes it worth tolerating. Particularly useful if you’re tracking global events that affect Indian markets, like Fed rate decisions or crude oil inventory reports.
How to Choose the Right Stock Market Analysis App
Start with one honest question: what are you actually going to use it for? If you’re a beginner who wants to learn how to read a company’s financials and build a watchlist, you need an app that explains the data, not one that buries you in charts with fifty indicator options. Stoxo and Tickertape are built for that. If you’re someone who already knows what RSI divergence looks like and just needs a fast, clean charting platform TradingView, no contest.
The second filter is how much you’re willing to pay. Most of these apps offer free tiers that cover the basics, but premium features real-time data on certain exchanges, more than three indicators, advanced screeners usually sit behind a subscription. Before upgrading, spend at least a month on the free version. You’ll quickly discover which features you actually use daily and which sounded useful but just sit there untouched. For a structured approach to picking the right method before picking the right app, how to analyse share market walks through that decision well.
Features That Matter for Beginners and Active Traders
For beginners: Look for apps that translate numbers into context. A P/E ratio of 32 means nothing to someone who started investing last month. An app that says “this stock is trading at 32 times its earnings the sector average is 19, so it’s priced at a premium” turns raw data into a usable insight. Virtual trading is another must-have. Practising with fake money on live market data builds skills without the financial sting of early mistakes. Stoxo’s virtual trading feature does this well.
For active traders: Speed and customisation matter more than hand-holding. Real-time quotes with minimal lag, one-tap order placement if the app connects to your broker, and the ability to set custom alerts “ping me when Nifty RSI drops below 30 on the 5-minute chart” are the features that actually save time and catch opportunities. Charting flexibility is essential too. If you can’t overlay multiple indicators, draw trendlines, and switch timeframes without the app freezing, it’s not built for active trading. For understanding how to read the charts these apps generate, stock market graph analysis covers the visual side of things.
Real-World Use Cases: How Different Investors Benefit
Take someone like Priya a salaried professional in Bengaluru who invests ₹15,000 monthly through SIPs but wants to start picking individual stocks for a small portion of her portfolio. She doesn’t have time to study charts during work hours. What she needs is an app that lets her screen stocks by fundamentals on Sunday evening, read quick AI summaries of the top matches, and add them to a watchlist she checks once a day. Tickertape’s screener plus Stoxo’s plain-language analysis is a combination that fits her life without demanding hours she doesn’t have.
Now take Arjun a final-year college student who day-trades during market hours between classes. He needs TradingView’s mobile charts with RSI and VWAP loaded, Moneycontrol’s news feed for earnings surprises that move prices intraday, and a virtual trading account to test strategies before putting his limited capital at risk. Two different investors, completely different app stacks, both pulling useful value from tools that cost nothing. The point isn’t finding the “best” app it’s assembling the right combination for how you actually invest.
Common Mistakes While Using Stock Market Apps
Treating app ratings as investment advice: A stock scoring 8/10 on an app’s rating system doesn’t mean it’s a buy. Those scores are based on backward-looking metrics past earnings, historical returns, current ratios. They can’t account for a management change next quarter or a regulatory crackdown next month. Use scores to shortlist, not to decide.
Overloading your screen with indicators: Adding twelve indicators to a mobile chart doesn’t make you more informed it makes you confused. On a phone screen, three indicators is already crowded. Pick two or three that you genuinely understand and can act on. Everything else is just visual noise.
Skipping the free version and paying immediately: Premium subscriptions make sense once you know what you need. Paying ₹999 a month on day one because the app promised “institutional-grade data” is throwing money at features you haven’t learned to use yet. Start free. Upgrade only when a specific feature limit is actually blocking your workflow.
Only checking one app’s view of a stock: Every app uses slightly different methodologies for scoring, screening, and generating signals. A stock that looks great on one platform might flag warnings on another. Cross-checking with a second source takes two minutes and catches blind spots that single-source analysis misses.
Using apps as a substitute for learning: The app is a tool, not a teacher unless it’s specifically designed to educate (like Stoxo). Relying purely on auto-generated signals without understanding why they fire leads to a dangerous kind of confidence. You feel informed but you’re not you’re just following instructions you can’t evaluate.
AI-Powered Tools Worth Watching
AI is reshaping what stock analysis apps can do, and the shift is happening fast. Stoxo already uses AI to generate plain-English company summaries and flag valuation concerns automatically. TradingView’s community-built scripts use machine learning to detect chart patterns that a human eye might miss. And apps like Perplexity are bringing conversational AI to finance you ask “should I worry about Tata Motors’ debt” and get a sourced, reasoned answer in seconds.
What’s coming next will go further. Imagine an app that monitors your entire portfolio in real time, flags when a holding’s quarterly results diverge from analyst expectations, and drafts a suggested action hold, trim, or add with a one-paragraph justification. Some of that exists in fragments across different platforms today. Within a year or two, it’ll be standard on free apps. The smart move right now is to get comfortable using AI-assisted analysis as one input alongside your own research because the people who learn to blend both are going to have a serious edge over those who rely on either one alone.
Best App Based on Your Investment Goal
| Your Goal | Best App | Why |
| Learning from scratch | StockGro Stoxo | AI explanations, virtual trading, educational context built in |
| Fundamental stock picking | Tickertape | Powerful screeners with dozens of filters, match scores for quick comparison |
| Technical / chart analysis | TradingView | Best-in-class charting on mobile, custom indicators, multi-timeframe support |
| Indian market news & earnings | Moneycontrol | Fastest updates on quarterly results, management commentary, corporate actions |
| Global market tracking | Investing.com | Broadest coverage Indian stocks, US equities, commodities, forex, economic calendar |
| Quick AI-powered research | Perplexity Finance | Conversational answers with cited sources great for rapid due diligence |
Conclusion
You don’t need all five apps on your phone. Pick one or two that match where you are right now and what you’re trying to do with your money. A beginner building their first watchlist needs different tools than a day trader scanning for breakouts at 9:15 AM. Start free, explore for a month, and only upgrade when a specific limitation is genuinely slowing you down. The best stock analysis app isn’t the one with the most features it’s the one you actually open every day and use to make better decisions than you would’ve made without it.
FAQs
What is the best stock market analysis app for beginners?
StockGro Stoxo it combines AI-driven stock analysis with plain-language explanations and virtual trading, so you learn and invest at the same time without needing prior experience.
Can I learn stock trading using virtual trading apps?
Yes. Virtual trading lets you practise with live market data and zero financial risk. It builds the habit of researching before buying and reviewing trades after closing both critical skills for real trading.
Which stock market app is best for technical analysis?
TradingView. Its charting tools, custom indicators, and multi-timeframe analysis are the best available on mobile. The free version covers most retail traders’ needs comfortably.
Are stock market analysis apps safe to use?
Yes, for analysis and education. Reputable apps like Stoxo, TradingView, and Moneycontrol don’t require demat access or trading permissions they’re data and research tools, not brokerage platforms.
How do stock market analysis apps help investors?
They give you access to real-time data, company financials, screeners, charting tools, and news all the information you need to evaluate a stock before committing your money, without relying on someone else’s opinion.
What features should I look for in a stock market analysis app?
Real-time quotes, fundamental data (P/E, earnings, debt levels), a stock screener with customisable filters, charting tools with at least basic indicators, and ideally a virtual trading mode for practising strategies risk-free.

Leave a Comment