By 2026, global commodity prices are predicted to have fallen by 5%, continuing the 12% decline in 2025. For many traders, this causes a big dilemma: which commodities should be watched when markets swing sharply down?
This is where commodity technical analysis comes in handy; it assists in the interpretation of trends, identification of reversals, and entry points during the chaos. This blog will cover some of the main patterns, indicators, strategies and more info related to technical analysis effectively in commodity trading so your trade is timely and your decisions are benefitting.
What Is Commodity Technical Analysis?
Before we get to discussing what commodity technical analysis is, we first need to learn about commodity trading. Commodity trading is a process of buying and selling raw materials such as gold, oil, and agricultural products in international markets. Commodity technical analysis consists of analysing past price data, volume, and market patterns to forecast the future price movements of these assets.
Rather than focusing on fundamental supply and demand, it looks at chart signals and price behavior. Many traders nowadays use AI for technical analysis in order to analyse massive quantities of data, discover hidden trends, and reduce human errors. It aims to help determine more appropriate entry and exit points and to better decision-making abilities during turbulent times in the commodity markets.
Key Chart Types & Patterns for Commodities
Charts form the backbone of commodity technical analysis, and some of the most commonly used chart types and patterns are as follows:
- Candlestick / Bar / Line Charts
Different chart styles give traders unique insights into price behavior:
- Candlestick charts: Widely used because they show open, close, high, and low in a single candle. Patterns like dojis or engulfing candles often signal reversals or trend continuations.
- Bar charts: Same as candlesticks yet less graphical. They still show open, high, low, and close, but are often favored by traders who prefer cleaner price representation without the “color” effect of candlesticks.
- Line charts: The simplest form, plotting only closing prices over time. Valuable for detecting longer-term patterns and removing extra fluctuations, though less precise for shorter-term choices.
- Patterns: Head & Shoulders, Triangles, Wedges, Double tops etc.
Chart patterns showcase shifts in momentum and possible future price direction. Key ones include:
- Head & shoulders: Signals a potential reversal. A head between two shoulders suggests weakening momentum; when the neckline breaks, a trend change often follows.
- Triangles: Can be ascending, descending, or symmetrical. Triangles reflect consolidation before a breakout; direction usually follows the prior trend but can surprise with reversals.
- Wedges: Rising or falling wedges suggest weakening price moves. A rising wedge often signals bearish reversal, while a falling wedge hints at bullish reversal.
- Double tops & bottoms: Double tops indicate strong resistance, often leading to bearish moves. Double bottoms show support, often preceding bullish reversals.
Important Technical Indicators for Commodity Traders
Commodity traders rely on technical indicators to interpret market signals and refine trading strategies. Some of the most useful indicators are:
- Moving average (MA)
Moving averages smooth out price fluctuations by showing the average price over a chosen period. In commodity trading, they help spot broader trends in volatile assets like crude oil or gold. A rising MA often indicates bullish sentiment, while a falling one signals weakness.
- Bollinger bands
Bollinger Bands calculate price swings applying a moving mean with standard deviation markers lines. For commodities, they highlight when prices are stretched too far from their mean, often preceding reversals. For example, sudden wheat cost surges beyond the higher range could indicate overvalued situations.
- MACD (moving average convergence divergence)
MACD tracks the relationship between two moving averages to show momentum shifts. Commodity participants apply it for locating possible entry areas, like when the MACD curve rises beyond its signal curve in silver or copper deals.
- Stochastic oscillator
This momentum indicator checks a commodity’s final price with its recent range. In commodities like corn or crude oil, values above 80 signal overbought conditions, while readings below 20 show oversold zones, guiding better timing decisions.
- Fibonacci retracement levels
Fibonacci levels highlight possible support or resistance zones built from numeric ratios. Traders use them in commodities like natural gas to predict pullbacks or continuation levels after strong price moves.
- Relative strength index (RSI)
RSI calculates the rate and variation of price shifts, scaled across 0 and 100. In commodities such as gold or soybeans, RSI helps traders measure whether a trend is strong or due for a reversal.
Timeframes & Strategy Approaches
Commodity trading strategies depend heavily on the timeframe chosen, as different horizons offer unique opportunities. The main timeframes and strategies are as follows:
- Intraday trading: Intraday trading focuses on buying and selling within the same day. Commodities like crude oil or silver are ideal due to high volatility. Traders often rely on short-term charts (5–15 minutes) and momentum indicators to capture quick price swings.
- Swing trading: Swing trading holds positions for several days or weeks. It uses daily or 4-hour charts to track medium-term trends. For example, a swing trader in gold may buy after identifying a bullish breakout on the daily chart and hold until momentum slows.
- Position trading: Position trading involves holding commodities for months based on strong macro or seasonal trends. Weekly and monthly charts guide these trades. A trader may hold natural gas positions ahead of winter demand spikes, using fundamentals and long-term patterns.
- Scalping: Scalping is ultra-short-term trading, seeking tiny profits from rapid moves. Scalpers in commodities like copper rely on 1-minute charts, high liquidity, and tight stop-losses to make multiple small trades in a single session.
- Trend-following strategy: Trend-following means riding established price movements using tools like moving averages or MACD. For example, traders might hold long positions in soybeans when the 50-day MA stays above the 200-day MA.
- Range-bound strategy: This approach works when commodities trade between support and resistance zones. Traders purchase near support then sell around resistance, usual within sideways gold and wheat exchanges.
Risk Management Specific to Commodities
Commodities face a variety of risks, including the following:
- Fraud or mis-representation risk
Goods or contracts may be falsely represented (e.g. wrong material, quantity or quality), leading to large losses. For example, Trafigura uncovered a nickel fraud in which containers bought were supposed to contain nickel but were found to contain lower-value materials instead. The company recorded around US$577 million in impairment from this case.
- Currency (exchange-rate) risk
When commodities are traded in foreign currencies or revenues/expenditures cross borders, currency fluctuations can significantly impact profitability or costs. The South African rand appreciated in early 2025, helped by record-high gold prices is a notable example of this risk. Since South Africa is a major gold exporter, stronger gold lifted export receipts and thus strengthened the rand. Firms exporting gold benefited; importers of inputs priced in foreign currencies saw costs change.
- Credit or counterparty risk
Counterparties may default on contracts, or financial and banking restrictions may impair transactions. India’s Nayara Energy, which has Russian-backed ownership interests, saw SBI (a bank) suspend foreign currency & trade transactions over concern of US/EU sanctions. This impedes its ability to transact in global crude oil markets and raises counterparty/operational risk.
Tools & Platforms for Commodity Technical Analysis
The rise of advanced platforms has changed how commodities are analysed. From gold and crude oil to agricultural futures, traders now rely on digital solutions that deliver real-time market insights, predictive analytics, and technical signals. These tools go beyond traditional charting software by combining price action with AI-driven intelligence to simplify decision-making in highly volatile markets.
Adding to this, newer AI-powered solutions are reshaping commodity research. Stoxo by StockGro, for instance, works as a conversational research assistant where traders can directly query markets. It provides structured outputs on price trends, support and resistance levels, and market sentiment, making insights more accessible for retail traders who may not be comfortable with complex dashboards.
Now, to understand how Stoxo simplifies commodity market research, let’s provide it with a simple query. We asked the AI tool: “What is the current trend for Gold on the daily chart, and where are the main support and resistance levels?”
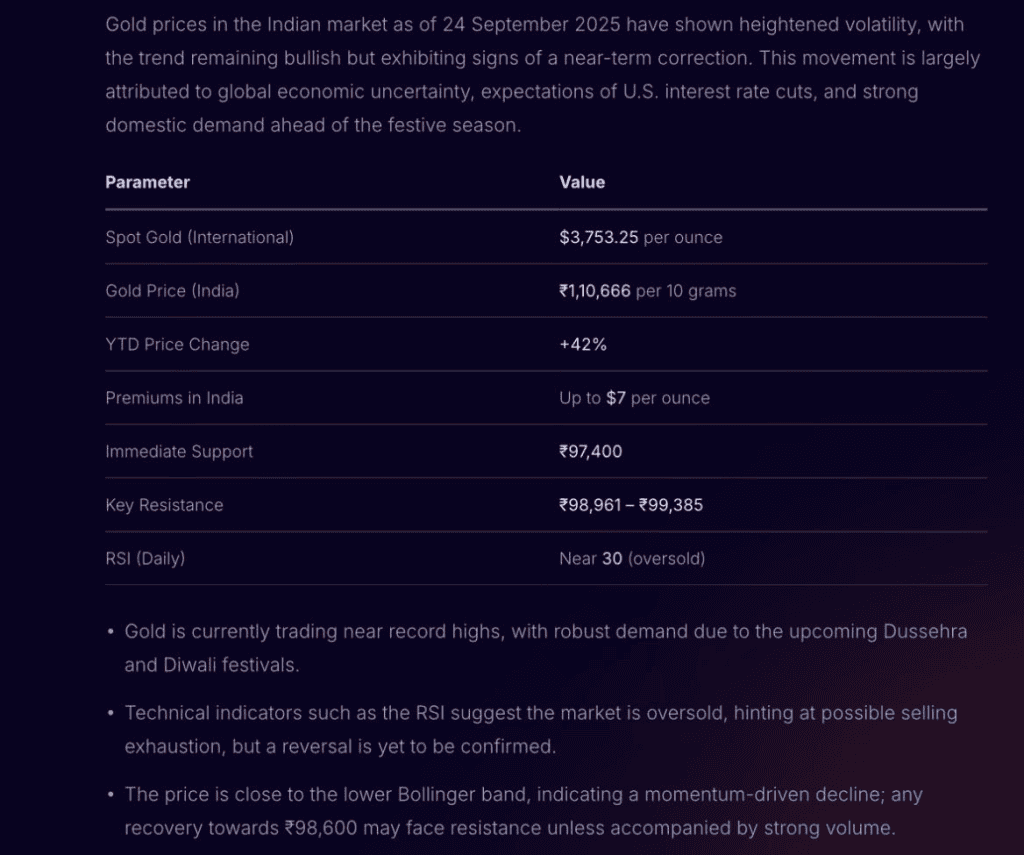
As seen in the response, Stoxo gave spot and domestic gold prices, year-to-date performance, and immediate support and resistance levels. It also flagged oversold conditions using RSI and explained the broader market sentiment around gold’s festive demand. This structured output allows traders to quickly assess opportunities and risks without manually parsing through charts or technical reports.
How Commodities Differ from Equities in Technical Analysis
Technical analysis in commodities and equities shares foundational charting methods, but significant differences arise due to the unique characteristics and market drivers of each asset class.
| Aspect | Commodity technical analysis | Equity technical analysis |
| Nature of assets | Focuses on physical goods (like metals, energy, agri products), typically traded via futures. | Involves ownership of business shares and mostly cash equities. |
| Primary market drivers | Heavily influenced by supply-demand imbalances, geopolitical events, weather, and seasonality. | Driven mainly by company performance, sector trends, and economic policies. |
| Price patterns | Stronger seasonal and cyclical price behavior; trends driven by macro events. | More diverse price patterns, often tied to business cycles and financial news. |
| Trading instruments | Mostly derivatives like futures and options; high leverage is common. | Primarily stocks, but also options and other derivatives. |
| Volatility | Generally higher—sharp moves from global events or supply shocks. | Moderate—tends to respond more gradually to earnings and market sentiment. |
| Investment horizon | Often short- to medium-term trading focused on trend exploitation. | Typically supports longer-term holding for capital growth and dividends. |
| Liquidity | Can vary greatly by commodity type; some segments are less liquid. | Usually more consistent liquidity, especially in large-cap stocks. |
| Role of fundamentals | Supply/demand stats, global inventories, weather forecasts critical for context. | Company financials, earnings outlooks, and fundamentals are more influential. |
| Technical tools usage | Heavy reliance on breakouts, seasonal/cycle analysis, trend indicators (e.g., moving averages). | Broad application of trend, momentum, and volume patterns, often paired with FA. |
| Trade timing factors | Exchange-specific trading sessions; extended hours for some commodities. | Fixed exchange trading hours, generally shorter than commodities. |
| Leverage and margins | Lower margin requirements but higher risk due to leverage in derivatives. | Higher margin in derivatives, but most equity trades are fully paid |
Case Studies: Applying Technical Analysis to Real Commodities
A 2024 study on the Multi Commodity Exchange from 2021-2024 provides a clear case of technical indicators at work on gold, silver, and natural gas. The analysis revealed several key signals that traders use to interpret market behavior and forecast price changes. The important observations from the study include:
- Gold (bollinger bands): A “W bottom” chart pattern appeared from January to March 2021, which is often interpreted as a buy signal as the price finds support and reverses upward.
- Silver (MACD): A bullish crossover occurred in February 2021, indicating a potential shift toward positive price momentum for the commodity.
- Natural gas (stochastic oscillator): The oscillator signaled potentially oversold conditions in January 2023 (reading below 20) and overbought conditions in September 2022 (reading above 80).
Common Mistakes & How to Avoid Them
New and experienced traders often fall into errors that can be costly. Some of the most frequent mistakes are as follows:
- Overtrading: Jumping into too many trades without a clear setup drains both capital and focus. In commodity trading, frequent entries on crude oil or gold due to fear of missing out often backfire. Sticking to a defined strategy and waiting for strong signals helps avoid unnecessary losses.
- Ignoring stop-loss orders: Skipping stop-losses exposes traders to unlimited downside, especially in volatile markets like natural gas. For example, a sudden spike against your position can wipe out weeks of gains. Always place stop-losses based on chart levels, not emotions.
- Relying on one indicator: Depending only on RSI or MACD leads to false signals. A trader shorting silver only because RSI was overbought may miss that moving averages showed a strong uptrend. Combining two or more indicators provides stronger confirmation.
- Neglecting risk management: Allocating too much capital to one trade or commodity magnifies risks. A balanced approach diversifies across assets like gold, silver, and agricultural products.
- Emotional trading: Fear, greed, plus impatience regularly drive investors into wrong choices, like holding against losing trades or leaving winners too early.
Building and following a written plan removes emotions from the process.
Future Trends in Commodity Technical Analysis
The future of commodity technical analysis is expected to grow significantly driven by technological, regulatory, and market structure changes such as:
- AI adoption
The global AI market is expected to grow at a compound annual growth rate (CAGR) of 35.9% between 2025 and 2030, reaching a valuation of $1.81 trillion by 2030, which will significantly enhance AI based analysis capabilities in commodity markets through real-time forecasting and automated trade execution.
- Volatility trends
Commodity price volatility remains historically high, with frequent sharp swings recorded between 2020 and 2024, the highest in at least 50 years. This volatility is forecasted to continue post-2025, emphasizing the need for adaptive and robust technical strategies.
- Market size and growth
The commodities market nominal value is projected to reach approximately $142.85 trillion during 2025 while is projected to expand at an yearly rate of 22.7% through 2030, underpinning sustained activity and innovation in technical analysis methodologies.
- Shift toward regional and policy-driven pricing
Increased regionalization of commodity supply chains and compliance with new environmental tariffs like the EU’s Carbon Border Adjustment Mechanism (CBAM) starting 2026 will create new technical pattern dynamics around policy shifts and trade flows.
- Expansion of new commodity classes
The rise of battery metals (lithium, nickel, cobalt), renewable energy certificates, and carbon credits will broaden the scope of technical analysis applied to these emerging commodities amid accelerating energy transition demands.
Conclusion
Commodity technical analysis shows how prices, trends, and patterns evolve in markets. By using charts, indicators, and digital tools, it helps understand movements in gold, oil, and agricultural commodities. Observing these patterns over time reveals market behaviour and potential shifts without making predictions.
FAQs
Commodity technical analysis involves studying price charts and historical market data to forecast future price movements. It uses patterns, trends, support/resistance, and indicators rather than supply-demand reports to help traders make informed entry and exit decisions in commodity markets.
Popular indicators include Moving Averages (MA), Relative Strength Index (RSI), MACD, Stochastic Oscillator, Bollinger Bands, and volume-based tools. These help track momentum, spot overbought/oversold conditions, and confirm price movement trends in commodities.
Support is a price level where a falling commodity finds buying interest, halting declines. Resistance is where selling emerges, capping rallies. Traders mark these levels using past lows/highs, trendlines, and moving averages to anticipate reversals or breakout trades.
Shorter timeframes (15-minute, hourly) suit intraday trading, while daily and weekly charts aid swing or positional trades. Choosing the right timeframe depends on trading style and desired holding period; longer timeframes filter out noise and highlight major trends.
Blend technical signals (trend, patterns) with fundamental drivers like inventory, crop data, geopolitical news, or weather. For example, a bullish breakout on charts matched with strong demand fundamentals increases conviction while technical signals can confirm or time entries after news-driven moves.
Common mistakes include over-relying on a single indicator, ignoring fundamentals, trading against the trend, neglecting risk management, and reacting emotionally to price swings. Overtrading and failing to adjust strategies for changing market volatility can also lead to losses.
Indicators can provide valuable signals, but their reliability drops during extreme volatility or news events. Whipsaws and false breakouts are more common, making it crucial to confirm signals, manage risk, and avoid overdependence on any single indicator in such environments.

Leave a Comment