Market data often looks like random noise to new observers, making it difficult to understand price movements. Learning how to analyse candlestick chart patterns transforms this confusing data into a readable story of buyer and seller behaviour. With the global online trading platform market projected to exceed $10 billion in 2025, retail participation is higher than ever, yet many struggle to interpret charts correctly. This guide provides a simplified, step-by-step approach to reading these charts effectively.
What is a Candlestick Chart?
A candlestick chart is a method of displaying the historical price movement of an asset over a specific time period. Originating from 18th-century Japanese rice traders, it provides more detailed information than a simple line chart. Each “candle” represents a specific timeframe (like one minute, one hour, or one day) and visually summarises the relationship between the opening, closing, high, and low prices, allowing traders to quickly assess the strength of buyers versus sellers.
Why Use Candlestick Charts in Trading?
Using candlestick charts provides distinct advantages, which are:
- Immediate visual clarity: While line charts typically only plot the closing price by connecting dots over time, candlesticks display the open, high, low, and close prices all at once. This colour-coded system allows traders to instantly gauge the strength and direction of price movement without needing to process complex raw data tables.
- Insight into market psychology: These charts serve as a visual representation of trader emotion, clearly showing the battle between buyers (bulls) and sellers (bears). A long green body indicates greed and buying control, while a long red body signals fear and selling pressure, helping analysts understand the sentiment driving the market.
- Early reversal signals: One of the most valuable aspects is their ability to signal turns in the market ahead of time. Learning how to analyse candlestick chart patterns can reveal when a trend is losing momentum before the price actually drops, giving traders a crucial head start compared to lagging indicators.
- Versatility: This charting method is universally applicable, working effectively across all timeframes, from one-minute scalping views to long-term monthly investment perspectives.
Components of a Candlestick (Open, High, Low, Close, Wicks)
To learn how to analyse candlestick chart patterns, one must understand the four price points, Open, High, Low, and Close, visualised by structures which include:
- The real body & its meaning
The wide, colored rectangular section is known as the “real body,” which represents the actual range between the opening price and the closing price of the specific time period.
- Green (or white) body: This colour signifies that the price closed higher than it opened, indicating that buyers were aggressive and in control of the session.
- Red (or black) body: This colour signifies that the price closed lower than it opened, indicating that sellers overpowered buyers and pushed the value down.
- Body size: The length of the body is significant; a long body implies strong conviction and momentum, whereas a small body suggests indecision or a lack of interest.
- Wicks/Shadows and their interpretation
The thin lines extending vertically from the body are called “wicks” or “shadows,” illustrating the extreme price levels reached outside the opening and closing range.
- Upper wick: The highest tip represents the “High.” A long upper wick suggests that buyers initially pushed prices up, but sellers eventually forced them back down before the close.
- Lower wick: The lowest tip represents the “Low.” A long lower wick indicates that sellers pushed prices down, but buyers stepped in to push the price back up.
How to Analyse a Candlestick Chart: Step-by-Step Workflow
The standard method for interpreting market data involves specific steps, which are:
- Identify the larger trend
Analysis begins by determining the overall direction of the market. This involves looking at a larger timeframe to see if the asset is in an uptrend (making higher highs), a downtrend (making lower lows), or moving sideways. Bullish patterns are generally considered more reliable during an uptrend, while bearish patterns are prioritized during a downtrend
- Locate key support & resistance zones
Price often reacts at specific historical levels. Support is a floor where price has bounced up previously, and resistance is a ceiling where price has been rejected. Traders mark these horizontal zones first. A candlestick signal is considered significant only if it appears near these key value areas, rather than in the middle of nowhere.
- Look for meaningful candlestick formations
Once the trend and key levels are established, the next step is to look for specific candle shapes. This involves spotting patterns that suggest a reversal (change in direction) or continuation (trend resumes). For example, a “Hammer” candle appearing exactly at a support level is a technical signal that buyers are defending that price.
- Confirm with volume, multiple timeframes & other indicators
A candle shape alone is rarely enough. Volume acts as a lie detector; a strong price move should be supported by high trading volume. Additionally, checking if the same signal appears on different timeframes helps validate the analysis. To simplify this verification, using a Stock market AI tool like Stoxo by StockGro is recommended, which aggregates real-time data and sentiment analysis to validate technical signals.
- Plan trade: entry, stop-loss, target
The final step in how to analyse a candlestick chart setup is defining the trade parameters. This involves calculating the risk-to-reward ratio. The entry point is usually defined after the candle closes. A “stop-loss” is placed beyond the high or low of the pattern to limit potential loss, while a target is set at the next support or resistance level.
Major Candlestick Patterns and What They Tell You
Traders classify candles into families based on the signals they provide. Some suggest the price direction is about to change (reversal), while others suggest the current direction will persist (continuation). The most recognised categories of patterns include:
- Single-candle patterns
These patterns consist of just one data point but offer immediate insight into market sentiment.
- Hammer: Found at the bottom of a downtrend, this has a small body and a long lower tail, suggesting buyers are finally pushing back against sellers.
- Doji: This looks like a cross because the open and close prices are nearly identical, signalling a moment of total indecision or a “tie” between opposing forces.
- Marubozu: A long, solid body with no wicks on either end. It indicates that one side (buyers or sellers) controlled the price from the very first minute to the last.
- Multi-candle patterns
These are often considered more reliable as they use context from previous sessions to confirm a shift.
- Engulfing pattern: A small candle followed by a larger opposite-colored one that completely “engulfs” the previous body.
- Harami: A large candle followed by a small one contained within the previous body, indicating a loss of momentum.
- Morning/evening star: Three-candle reversal patterns. The Morning Star is bullish (appearing at a low), and the Evening Star is bearish (appearing at a high).
- Continuation patterns & indecision signals
Not all shapes predict a change in direction; some confirm that the current path will persist.
- Three white soldiers/ three black crows: These are sets of three consecutive long candles moving in the same direction (green for up, red for down). They confirm that the trend is healthy and likely to continue.
- Spinning top: Similar to Dojis but with slightly larger bodies, these indicate the market is catching its breath before the next leg of the trend begins
Applying Candlestick Analysis in the Indian Market (NSE/BSE, Intraday & F&O context)
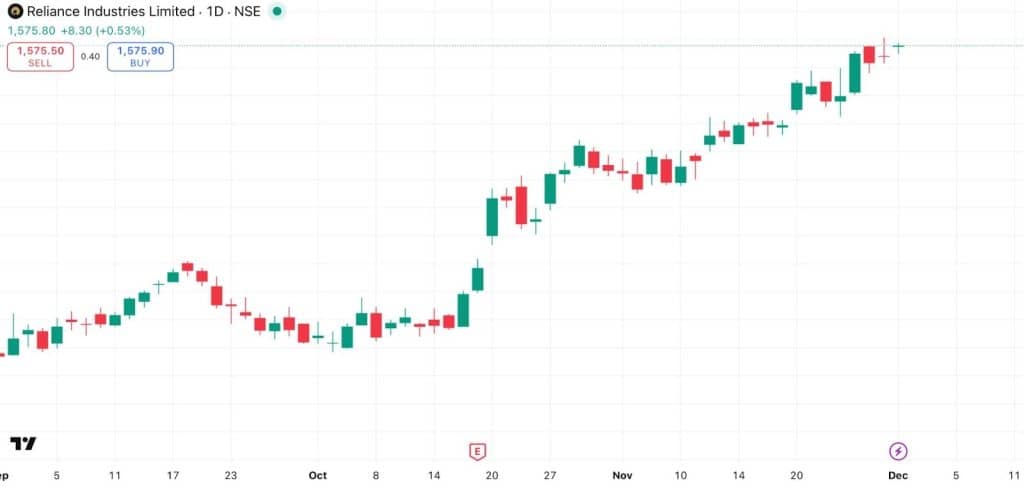
Now, let’s take an example of their Reliance Industries chart to understand the practical applications of candlestick analysis, discussing specific trading scenarios which include:
- Intraday strategy case study using candlesticks
In the screenshot, the final candle represents the current day’s trading, showing the price at 1,575.80 with a gain of +0.53%. An intraday trader analysing this setup observes that the previous few daily candles (Late November) were strong green candles, establishing a clear bullish momentum. Using this daily context, the trader enters the session with a “buy” bias.
If they switch to a smaller 15-minute timeframe and see a Bullish Flag or a Hammer forming around the 1,565-1,570 level, they might interpret this as a low-risk entry point, aiming for the day’s high of 1,575.90 as a target, knowing the larger daily trend supports upward movement.
- Swing trading scenario using candlesticks
Swing traders focus on the multi-week trend visible from October to December. In this chart, a classic swing opportunity appeared in early November. After the initial rally from the October lows, the stock experienced a brief “pullback,” represented by the small cluster of red candles in the middle of the chart (likely around the 1,450 level). A swing trader would watch this consolidation closely.
When the subsequent large green candle formed and broke above this consolidation zone in mid-November, it signalled that the uptrend was resuming. A trader following this signal would have entered the trade there, holding the position as the stock climbed toward the 1,575 resistance level seen at the end of the chart.
Common Mistakes & Pitfalls in Candlestick Chart Analysis
Even with a solid understanding of patterns, new traders often face challenges by falling into traps. The most common errors in analysis typically include behaviours such as:
- Trading patterns in isolation: A common mistake is seeing a “Hammer” candle and buying immediately without checking if the market is in a downtrend or at a support level. Context is equally imperative.
- Ignoring the trend: Trying to pick “tops” and “bottoms” against a strong trend is risky. A bearish candlestick pattern in a strong uptrend often fails.
- Neglecting the closing price: Traders often react before the candle has closed. A candle might look like a bullish signal with 5 minutes left, only to close as a bearish signal. Always wait for the close.
- Overlooking volume: Price action without volume support is often a “fakeout.” A breakout candle with low volume is likely to fail.
- Analysis paralysis: Looking for too many perfect conditions can lead to missing good trades. Simplicity is often more effective than complexity.
Practical Checklist / Cheat-Sheet for Candlestick Chart Analysis
A disciplined validation process is essential for accuracy when interpreting market data, utilising a standardised checklist which includes:
- Trend alignment: Identification of the dominant market direction on a higher timeframe ensures alignment with broader momentum, reducing the risk of acting on isolated signals against the primary flow.
- Location significance: A pattern carries weight only when forming at key value areas like historical support or resistance levels; signals appearing in the middle of a range are often disregarded as noise.
- Pattern closure: Learning how to analyse candlestick chart patterns requires patience, as action is taken only after the candle fully closes to prevent acting on temporary shapes that shift before the session ends.
- Volume confirmation: A valid reversal or breakout usually aligns with increased trading volume, indicating strong participation and conviction rather than a potential false signal.
- Risk assessment: Verification of a logical stop-loss placement and a favourable risk-to-reward ratio helps maintain a balanced approach to capital exposure before any commitment is made.
Summary & Next Steps for the Trader
Candlestick patterns serve as tools to decode market behaviour rather than predict the future with certainty. By understanding how to analyse candlestick chart data, traders can spot risks early and manage expectations. This knowledge transforms random price movements into a readable story, helping investors stay disciplined and stick to their trading plan.
FAQs
Each candle shows open, high, low, and close prices. A green body means buyers won (close > open), a red body means sellers won. A long body shows strong control, wicks show intraday extremes. Start with a daily timeframe to see who dominated each session clearly.
Mark historical support floors and resistance ceilings first. Only trade patterns appear exactly at these zones, a hammer at support or engulfing at resistance. Patterns in the middle of ranges lack context and usually fail. Location determines signal quality.
A few of the most common candlestick patterns include hammer, doji, Marubozu, engulfing, harami, morning/evening star, and three soldiers/crows. Context determines reliability, trend alignment, and support/resistance location matter most.
Never trade patterns without trend context or support/resistance. Don’t enter before the candle closes. Ignore low-volume signals. Avoid analysis paralysis from too many patterns. Always wait for confirmation and use stop-losses beyond pattern extremes.
Check the 15-minute trend first, enter on 5-minute patterns at intraday support/resistance. Prioritise hammer/engulfing/shooting star with volume. Use tight stops below pattern lows. Focus on the first 2 hours when volume and volatility peak the highest.
Yes, daily/weekly patterns time swing entries perfectly. F&O traders combine candlesticks with options Greeks and volatility. The same principles scale across timeframes. NSE cash, futures, and options all respond to quality patterns at key levels.

Leave a Comment