
In options trading, prices don’t just move with the stock, they also change with time, volatility, and trader activity. This usually makes it hard to judge the right entry or exit. To assist traders, an option chain provides a comprehensive view of all call and put contracts for a particular stock or index. It lists strike prices, expiry dates, volume, open interest, and implied volatility, offering important data points for informed decision-making.
In April 2025 alone, global exchange-traded options and futures volume reached approximately 9.5 billion contracts, a 2.3% increase from March 2025, showing ongoing active participation despite shifts in market dynamics. Understanding how to analyse option chain allows traders to better understand these figures and apply them effectively. This blog will guide you through these essentials in detail. .
How to Analyse Option Chain
To analyze an option chain, focus on Open Interest (OI), Volume, market sentiment, Implied Volatility (IV) and the Greeks (Delta, Theta, Vega, etc.). An option chain provides a comprehensive snapshot that represents all call and put options existing for the security in question. However powerful the data, manual sorting can be exhausting. An AI-powered tool like Stoxo facilitates instant interpretation of this data by dissecting the core elements of this information.
In order to grasp how the process operates, you must first identify what these core components are.
Key components: Strike, Expiry, Bid/Ask, Volume, Open Interest
Now, let’s take a look at the elements that are the building blocks of every option chain, shaping how contracts are priced and how traders interpret opportunities.
- Strike price: The level at which you can buy (call) or sell (put) the underlying. It shows potential profit/loss levels.
- Expiry date: Options lose value as they approach expiration, making time selection crucial.
- Bid/ask spread: Indicates liquidity. A narrow spread suggests active trading, while a wide spread may mean illiquidity.
- Volume: Reflects how many contracts were traded in a session. Higher volume means stronger interest and better trade execution.
- Open interest (OI): Shows outstanding contracts yet to be squared off. Rising OI with rising price signals bullishness, while falling OI may hint at trend reversal.
Intrinsic vs Extrinsic Value (Premium Analysis)
Every option premium consists of intrinsic and extrinsic value, and understanding both is crucial for evaluating fair pricing, here’s how they differ:
| Aspect | Intrinsic value | Extrinsic value |
| Definition | The real, tangible value of an option if exercised today. | The time and volatility value beyond intrinsic worth. |
| Formula | Call = Max(0, Spot – Strike); Put = Max(0, Strike – Spot) | Premium – Intrinsic Value |
| Dependency | Depends only on spot price vs strike. | Depends on time to expiry, implied volatility, and market demand. |
| Impact of time decay | Not affected by time decay. | Declines daily as expiry approaches. |
| Trading insight | Indicates actual in-the-money value. | Displays market’s expectation and risk appetite. |
Role of Implied Volatility & Greeks (Delta, Vega, Theta, Gamma, Rho)
Implied Volatility (IV) reflects the market’s expectation of future price swings. Alongside IV, Greeks quantify risk and help traders assess how sensitive options are to different factors.
- Delta: Measures how far an option’s price shifts for every ₹1 movement in the underlying. Calls have positive delta, puts negative. High delta options react more strongly.
- Gamma: Shows how quickly delta itself varies with the underlying’s price movement. It helps anticipate sudden risk spikes.
- Theta: Represents time decay. As expiry nears, theta accelerates, eroding option value especially for out-of-the-money contracts.
- Vega: Measures sensitivity to volatility changes. Higher vega means the option gains or loses more when IV shifts.
- Rho: Captures how interest rate changes affect option prices. Its impact is generally smaller compared with other Greeks.
- IV: A high IV inflates premiums, signaling uncertainty, while low IV reduces them, suggesting calmer markets.
Liquidity Insights: Volume & Open Interest
Options liquidity ensures tighter spreads, better execution, and reliable price discovery. The core indicators such as, are:
- Volume: Shows contracts traded on a given day. High volume suggests active participation.
- Open interest (OI): Indicates existing open positions. Rising OI confirms trend strength; falling OI suggests exits.
- Bid-ask spread: Narrow spreads imply liquid contracts, making them cheaper to enter and exit.
- Trend confirmation: Increasing OI with rising price = bullish; rising OI with falling price = bearish.
- Strategy selection: Traders prefer liquid strikes for spreads, straddles, and hedges since illiquid contracts pose higher slippage risks.
Identifying Mispriced Options & Volatility Smile
Options are often mispriced when the IV curve across different strike prices doesn’t match the usual “smile” or skew shape. A volatility smile appears when deep in-the-money or out-of-the-money (OTM) contracts have higher IV relative to at-the-money (ATM) options for the same tenor. Here’s how to detect mispricing:
- Compare IV of different strikes for the same expiry if the wings (ITM/OTM) are priced much higher than the centre (ATM), it may signal a volatility smile.
- Check whether market models (e.g. Black-Scholes) assumptions break: they assume constant volatility, which is often unrealistic.
- Look for “skews” or “smirks” asymmetric smile shapes where puts or calls are more expensive relative to others.
- Watch for changes over time. Volatility surfaces or “moneyness surfaces” can shift as supply/demand, risk or external events change.
Recognising mispricing via the volatility smile allows traders to find opportunities e.g. buy undervalued options or sell overpriced ones while accounting for risk from extreme moves.
How to Spot Unusual Activity & Market Sentiment
Unusual market activity often reveals sentiment shifts and hidden trading intentions, including:
- Volume spikes
Volume spikes happen when a stock’s trading volume jumps sharply beyond its average, usually triggered by impactful news or partnerships that attract investor interest. A notable example of this is when on September 16,2025, KNR Constructions saw a 28.58 fold volume surge after reports of a major partnership. The stock price rose 8.17% showcasing how such news-driven volume spikes can affect market moves.
- Unusual options activity
Unusual options activity occurs when options trading volume or open interest spikes unusually high, signaling informed traders betting on a significant stock move. For example, in March 2025, NTPC’s 360 strike call options expiring on March 27 showed a Volume/Open Interest ratio of 17.46, far exceeding typical levels. This unusual call buying signaled bullish sentiment and preceded a strong price surge in NTPC’s stock, displaying how unusual options activity can forecast significant market moves.
- Price gaps
Insider trading analysis has shown insiders often trade heavily just before major company news releases, causing price gaps at market open. Some of these situations could include instances such as directors buying large stock amounts before positive announcements create upward price gaps reflecting informed speculation.
- Put-call ratio (PCR)
The PCR is tracked closely as a sentiment gauge; a high put-to-call ratio signals bearish sentiment, while low PCR indicates bullishness. For example, a PCR above 1.0 often signals growing caution among traders ahead of market declines
- Institutional moves
Institutional traders such as pension funds and hedge funds execute large block trades that significantly impact price trends. These players’ coordinated buying or selling can cause volatility and trend shifts in affected stocks.
- Social & news flow
A prime example is the US GameStop rally in early 2021, where social media fueled coordinated buying, driving the stock price sharply upward, demonstrating how news and social sentiment can amplify market moves.
Step-by-Step Option Chain Analysis Process
Option chain analysis helps identify trader positioning and key market levels, as follows:
- Check the underlying price: Begin with the Current Market Price (CMP), which is simply the latest trading price of the stock or index. This acts as the anchor for analyzing surrounding strikes.
- Identify strikes near CMP: Focus on strike prices closest to the CMP. These “at-the-money” and “near-the-money” options carry the highest activity, making them the most relevant for short-term signals.
- Examine open interest (OI): High OI at specific strikes signals strong trader positioning. For example, heavy put OI below CMP often highlights a potential support zone.
- Track OI change: Rising OI indicates fresh positions being created, while falling OI suggests unwinding. This reveals whether market participants are adding or exiting trades.
- Compare calls vs. puts: A build-up in call OI usually marks resistance, whereas heavy put OI highlights support. Comparing the two offers directional cues.
- Analyse IV: Rising IV shows heightened market expectations of bigger price swings, while falling IV reflects stability.
- Confirm with volume: Always validate OI changes with trading volume to ensure they reflect genuine activity rather than passive positioning.
Tools & Platforms to View Option Chains
Traditionally, traders accessed option chain data through brokerage terminals or financial news platforms. While these sources provided strike prices, volumes, and open interest, the analysis was left to the user. With the rise of stock market AI, a new wave of tools is making this process more efficient. Platforms like Stoxo AI go beyond simply displaying raw data, they interpret it.
Instead of navigating large tables of numbers, investors can now receive concise, easy-to-understand insights, making option chain analysis more accessible.
- Example Walk-through with Real Chain
To understand how an AI tool can streamline option chain analysis, let’s look at an example for the NIFTY 50 index using Stoxo. After being asked to “Show me the option chain for NIFTY 50 for this week. Tell me which strike prices have the highest open interest and whether traders look more bullish or bearish,” the AI provided the following analysis:
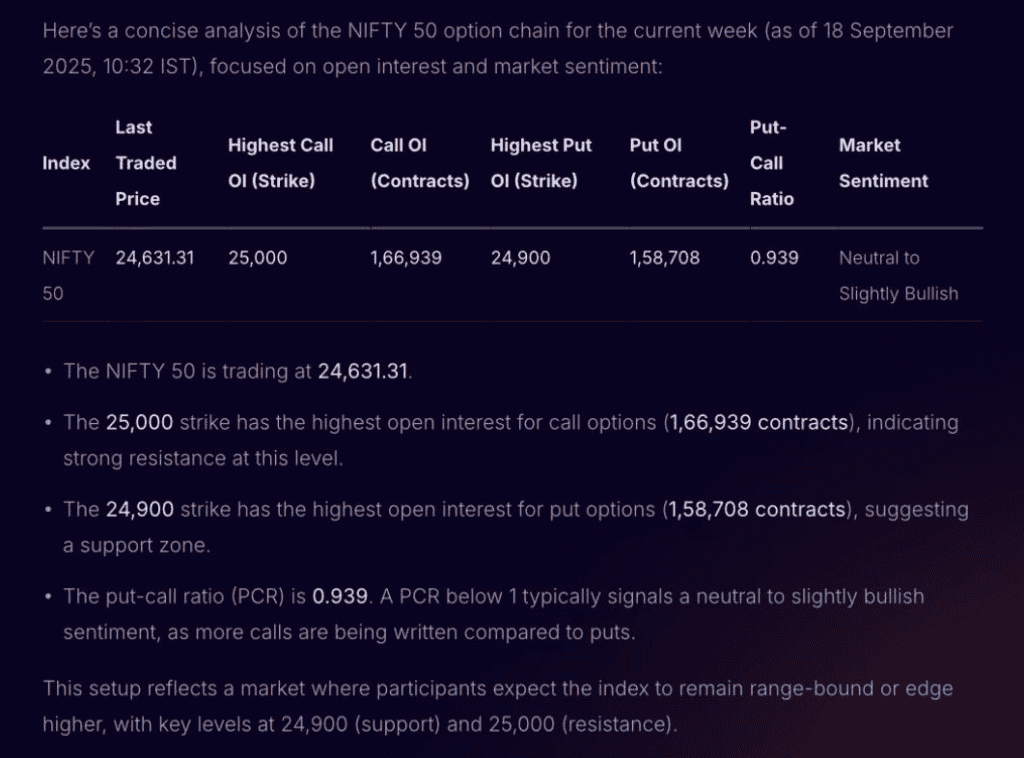
The AI immediately processed the complex option chain data to provide a concise summary. It identified the 25,000 strike as the key resistance level and the 24,900 strike as the main support, based on the highest open interest for calls and puts. This instantly clarifies the expected trading range and market sentiment without requiring manual calculations.
Advanced Strategy: Using Chains in Spreads & Straddles
To manage risk in a market where a SEBI study found 93% of individual equity F&O traders lose money, advanced traders use the option chain to build precise, risk-defined strategies like spreads and straddles as follows:
- Building spreads with the option chain
When anticipating a moderate increase in a stock’s price, a trader can construct a bull call spread. By viewing the call options on the chain for a specific expiry, they would buy a call at or near the current stock price and simultaneously sell another call at a higher strike price. The premium received through selling the higher-strike contract offsets the expense of the one purchased.
This creates a debit spread where the maximum potential loss is limited to the net premium paid, and the maximum profit is capped.
- Building straddles with the option chain
For situations where a large price move is expected but the direction is unknown, a trader builds a long straddle. Using the option chain, they locate the at-the-money (ATM) strike price and, for the same expiration date, buy both the call and the put at that single strike. This creates a position that profits from significant volatility.
The maximum risk is limited to the total premium paid for both options, and the trade becomes profitable if the stock’s price moves sharply in either direction, surpassing that total cost.
Conclusion
AI is changing the way market data is read and understood. Instead of replacing traditional methods, it adds value by turning raw numbers into clear insights. When it comes to how to analyse option chain, AI can show patterns in sentiment and activity that are not immediately visible. This shows how technology is helping make complex information easier to interpret without changing the core data itself.
FAQs
An option chain lists all available option contracts for a stock, showing calls and puts by strike price and expiry date. Reading it involves understanding sections for calls and puts, strike prices, premiums, bid/ask, volume, open interest, and implied volatility, helping traders assess market sentiment and opportunities.
Bid is the highest price buyers offer; ask is the lowest sellers accept. Volume shows contracts traded during the day, indicating activity. Open interest represents outstanding contracts, revealing liquidity and trader interest. Together, these metrics guide understanding of option demand, price direction, and potential market moves.
IV measures expected future volatility of the underlying stock. Higher IV increases option premiums due to higher risk and potential price swings, while lower IV reduces premiums. Traders use IV to gauge market sentiment and price options fairly based on anticipated fluctuations.
The Greeks such as the Delta, Gamma, Theta, Vega, and Rho quantify sensitivities of an option’s price to variables like underlying price, time decay, volatility, and interest rates. They help traders understand risk, manage hedges, and predict option price behavior under different market scenarios.
A volatility smile is a pattern where implied volatility is higher for deep in-the-money and
out-of-the-money options than for at-the-money options. It suggests market expectations of larger price moves beyond normal forecasts, often indicating higher risk or market uncertainty
Option chain data helps identify strike prices with high open interest and volume, aiding selection of contracts for spreads, straddles, or strangles. Analysing premiums, IV, and Greeks supports building strategies to capture price moves, hedge risk, or generate income aligned with market forecasts.

Leave a Comment