
Retail participation rose sharply over the years. In June 2025, India had over 24 crore mutual fund accounts, with 91.3% held by retail investors. However, despite this growing involvement, many investors still lacked proper analysis or understanding of business fundamentals.
A SEBI report from July 2024 highlighted this gap, showing that 7 out of 10 individual intraday traders in the equity cash segment faced losses due to poor analysis and lack of strategy. This shows why it’s important to learn how to analyse stocks by looking at a company’s fundamentals, market position, and growth prospects. With the right approach, you can make informed choices, avoid emotional decisions, find strong stocks, and build a portfolio that fits your financial goals . So, let’s get into its details in this blog.
How to Analyse Stocks
Analysing stocks is an integral setup for any investor aiming to make informed decisions rather than relying on speculation. It involves a detailed examination of a company to determine its financial health, growth potential, and the fair value of its shares. The main methods and steps involved in a thorough stock analysis are as follows.
Step 1: Use the Right Research Tools
Modern investing success starts with using the right research tools. Traditional sources like annual reports are still useful, but things have changed. The biggest shift is the rise of stock research AI, tools that can scan massive amounts of market data in seconds and deliver quick, accurate insights.
One such tool is Stoxo, an AI-powered platform built for retail investors. It lets you ask stock-related questions in plain language and gives clear, data-backed answers. Combining reliable financial portals with AI tools like Stoxo can give you a real edge in making better investment decisions.
Step 2: Fundamental Analysis
Once you have your tools ready, the next step is to dive into the company itself. This is done through fundamental analysis, a method of evaluating a stock’s intrinsic or “fair” value. Fundamental analysis studies a company’s financial strength, management efficiency, and market conditions to assess its true value.
- Reading Annual Reports
The primary sources for fundamental analysis are a company’s official financial statements, found in their annual and quarterly reports. These reports give an in-depth understanding of the company’s financial performance and stability, covering key details such as:
- The income statement: Shows revenues, expenses, and profits over a period.
- The balance sheet: Offers a quick view of assets, debts, and shareholder equity at a given date.
- The cash flow statement: Highlights how cash moves through business operations, investments, and financing.
While essential, these reports are often lengthy and filled with jargon, making them difficult for beginners to digest.
- Key Ratios: P/E, EPS, ROE
To simplify the data from financial statements, investors use key ratios to quickly assess a company’s health. Some key indicators are:
- P/E (price-to-earnings) Ratio: Measures the ratio between the firm’s stock price and the income generated per share. A higher P/E may suggest overvaluation, whereas a lower one could imply undervaluation.
- EPS (earnings per share): Represents the company’s profit allocated to each share of stock. A steady rise in EPS generally reflects healthy financial progress.
- ROE (return on equity): Evaluates how efficiently management uses shareholders’ funds to produce income.
Manually calculating these ratios and interpreting dense reports is a significant hurdle. This is where AI can dramatically speed up the process. An investor can perform a quick stock valuation with Stoxo by asking a direct question about a company’s fundamentals. For example, you could ask the AI to summarise the key financial health metrics for a company.
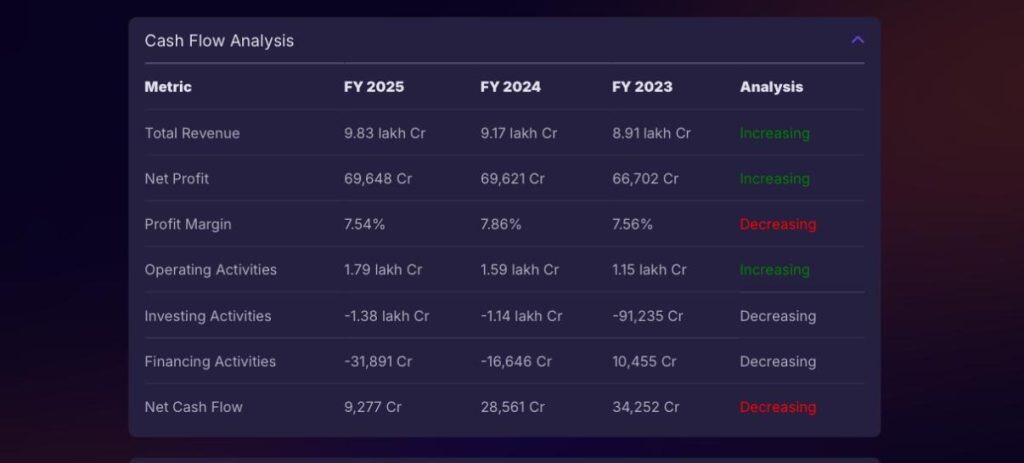
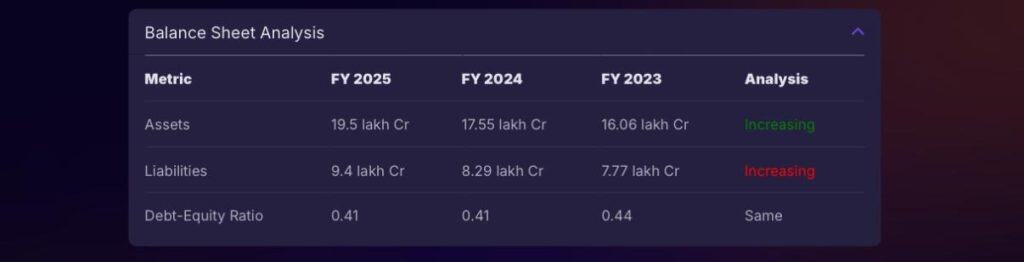
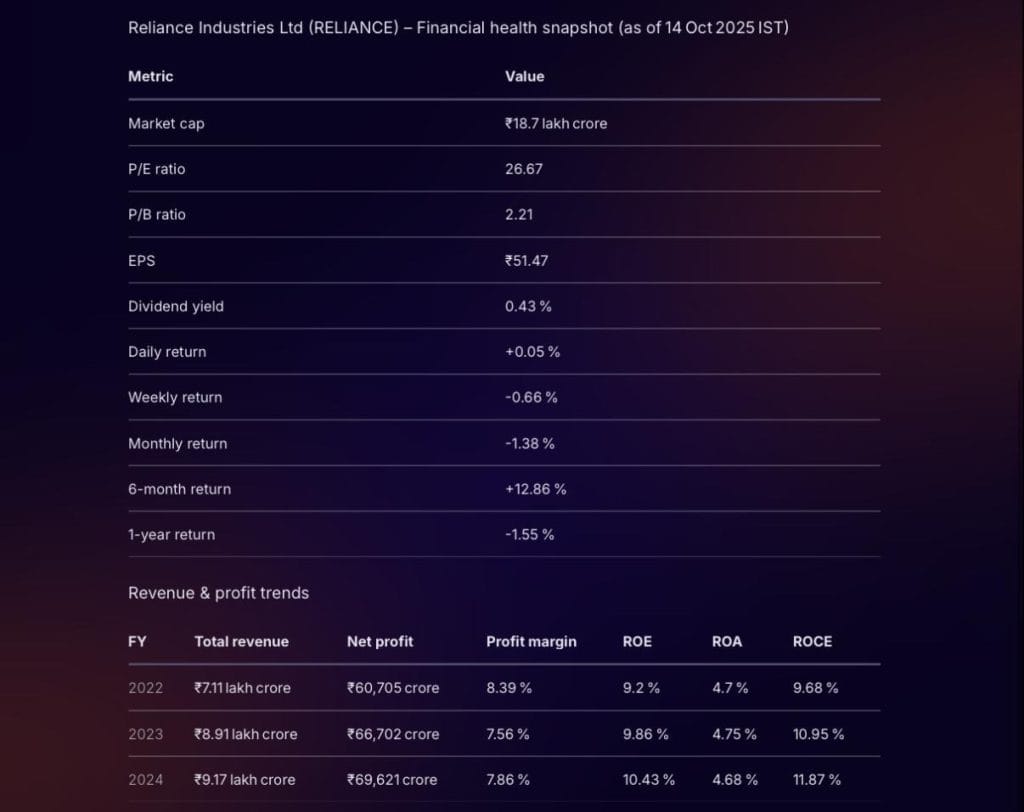
And it would provide a concise breakdown, including the vital ratios shown in the images above.
Step 3: Technical Analysis Basics
The debate between fundamental vs technical analysis represents two major schools of thought in the market. As discussed above, fundamental analysis assesses a company’s intrinsic value, technical analysis focuses on its stock’s price and volume history to forecast future movements. This method is based on the idea that all known information is already reflected in the stock’s price and that historical patterns tend to repeat.
Beginners should familiarise themselves with a few core concepts:
- Price charts: Candlestick charts provide a clear visual of price action by showing the opening, highest, lowest, and closing points over time.
- Support and resistance: These mark price zones where the stock often halts its decline (support) or rise (resistance).
- Moving averages: These indicators even out price data to reveal general price direction.
Using advanced technical analysis tools like Stoxo scan smooth out the hiccups of this process. Instead of manually drawing trend lines or calculating indicators, you can ask the AI directly for insights, such as, “What is the current trend for this stock?” or “Identify key support and resistance levels.” This interactive approach makes technical analysis faster and more intuitive.
Step 4: Qualitative Insights
Apart from financial ratios, a full evaluation also considers qualitative aspects that reflect a company’s durability and market position. These non-numerical aspects are crucial for understanding the story behind the stock. The core qualitative insights to consider include:
- Business model: how the company earns its revenue? Is its revenue stream sustainable and diversified?
- Competitive advantage (Moat): What gives the company an edge over its competitors? This could be a strong brand (like Apple), a network effect (like Meta), or cost advantages. A wide moat makes it difficult for others to enter its market.
- Management quality: Knowing how to evaluate company management is of utmost importance. Investors should look for a leadership team with a clear vision, a proven track record of execution, transparent communication, and shareholder-friendly policies.
Step 5: Analyst Reports & Sentiment
While conducting your own research is essential, it is also valuable to consider the opinions of professional market analysts. These experts work for brokerage firms and investment banks, and their job is to conduct in-depth research on specific companies and sectors. Analyst reports typically provide:
- A “buy,” “sell,” or “hold” rating on a stock.
- A target price reflects analysts’ projections of the stock’s future valuation.
- A detailed thesis explaining their reasoning, based on financial models and industry outlook.
Avoid basing your decision solely on one analyst’s perspective. Instead, look for a consensus view by reading reports from multiple sources. This, combined with overall market sentiment (whether the general mood is bullish or bearish), can provide a more balanced perspective.
Step 6: Stock Screeners & Filters
The stock market contains thousands of listed companies, making it impossible to analyse each one. Stock screeners are indispensable tools that help investors filter this vast universe down to a manageable list based on specific criteria.
Traditionally, stock screeners make users enter parameters such as market capitalisation, P/E ratio, or dividend yield manually. However, AI-powered tools enhance this process.
With Stoxo, you can use natural language prompts to do the screening for you. Like when asked to, “Find me mid-cap IT stocks with a P/E ratio below 20 and revenue growth above 15%,“.
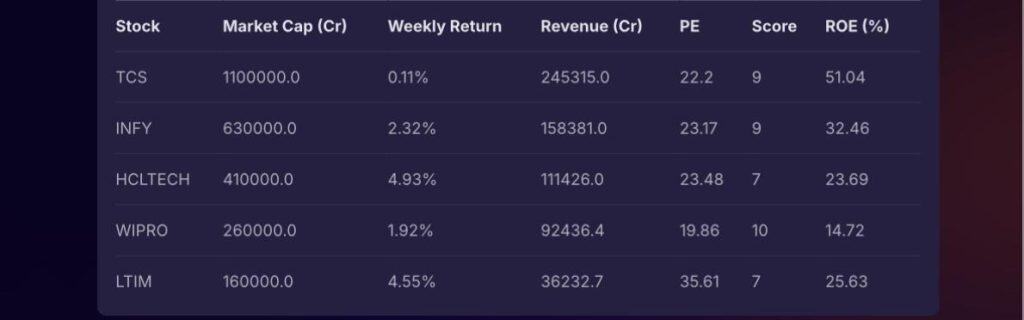
It provides the list of top performers instantly, saving significant time and effort.
Step 7: Practice via Simulators & “Buy & Homework”
Before committing significant capital, it is wise to test your analysis and strategies in a risk-free environment. Simulated trading platforms let you test stock buying and selling using digital funds instead of real money. This is an excellent way for beginners to introduce themselves with market dynamics and see how their analysis plays out in real-time without financial consequences.
Another effective learning method is the “Buy & Homework” approach. This involves making a very small, trial investment in a company you have researched. Owning even one share creates a psychological stake that encourages you to follow the company more closely, reading its quarterly reports, listening to earnings calls, and tracking industry news. This hands-on experience provides practical learning that is hard to replicate otherwise.
Step 8: Compare & Monitor Portfolio
Stock analysis doesn’t end after you buy a stock; it is an ongoing process. Once a stock is part of your portfolio, you must continuously monitor its performance and compare it against relevant benchmarks. The fundamental monitoring activities are as follows:
- Industry peer comparison: How is your stock performing relative to its direct competitors in the same industry? If the entire sector is down, a drop in your stock’s price may not be a company-specific issue.
- Index benchmarking: Checks if your stock is performing better or worse than major indices like the Nifty 50 or Sensex.
This helps ascertain its performance against the broader market. - Reviewing financials: Keep up with the company’s quarterly earnings reports to ensure its fundamental health remains intact and aligns with your initial investment thesis.
Regular review allows you to determine whether to hold, exit, or increase your investment using new data.
Advanced Metrics: Relative Strength (RS)
For investors who want to go a step further, Relative Strength (RS) is a powerful metric. Do not mix up RS with the Relative Strength Index (RSI), as they represent different metrics.
Relative Strength compares a stock’s performance against that of its sector or the overall market. An RS line is plotted on a chart, and its direction indicates performance:
- An upward RS line indicates the stock is outperforming its benchmark.
- A downward-sloping RS line indicates the stock is underperforming the market.
Many successful investors look for stocks with strong RS, as it suggests institutional demand and a healthy price trend.
Putting It All Together
This blog has provided the tools and the framework, but the actual work is just beginning. Think of how to analyse stocks not as a checklist to be completed, but as a skill that you build over time. Each company you research adds to your experience. The aim isn’t immediate perfection but growing into a better-informed, more confident investor with each analysis.
FAQs
Combine fundamental analysis, technical analysis, and peer comparison for a holistic stock review. Use financial statements, chart patterns, and tools like Stoxo to interpret data, check management quality, and compare against competitors for smarter investment decisions.
Read annual and quarterly reports, calculate key ratios like P/E, EPS, and ROE, and review business model sustainability. Evaluate industry position, management reputation, and compare metrics against peers for clearer company valuation and future potential.
Beginners should use moving averages for trend direction, RSI to identify overbought/oversold zones, MACD for trend strength, and bollinger bands to gauge volatility. Support and resistance levels aid entry/exit decisions and simplify technical analysis basics.
Compare by analysing key ratios, returns, and financial metrics against direct competitors and sector benchmarks. Use screeners or AI tools for side-by-side comparisons. The relative strength line shows if a stock is outperforming or lagging its industry or index.
CANSLIM screens for current earnings, annual growth, new products, supply and demand, leader/laggard status, institutional buying, and narket direction. This growth stock method uses seven criteria to identify companies with breakout potential and strong fundamentals.
Tools like Stoxo scan market data, speed up ratio analysis, and simplify screening. They save time, reduce manual errors, and provide objective insights, helping investors filter, compare, and analyse stocks faster to improve decision-making for long-term goals.
Reassess stocks at least every quarter, matching company earnings cycles and sector updates. Monitor more often if market events or company news arise. Periodic review ensures the portfolio stays aligned with financial goals and responds quickly to changes.

Leave a Comment