Every morning, countless retail traders log in to their terminals hoping to benefit from the day’s price moves, but many see their trades turn negative within minutes. The issue isn’t just bad luck, it’s often the lack of structure, timing, and a tested plan for short-term price action.
In fact, as per a 2024 SEBI report, roughly 1 in every 3 individual traders in the equity cash segment engages in intraday trading, proof of how active and competitive this segment is. Intraday trading means you buy and sell a stock within the same day to make a profit from its fluctuating price, ensuring you don’t hold it overnight. In such a fast-moving setup, entry and exit strategy becomes essential, as emotions can easily override logic. In this blog, we’ll discuss how to do intraday trading for beginners looking for a defined approach that helps them scale in this market successfully.
How to Do Intraday Trading
A systematic approach is important for matching the swift pace of intraday trading. The fundamental steps required to begin, from account opening to strategy execution, are as follows.
Step 1: Open a Trading & Demat Account
To get started in intraday trading, an individual needs two main types of accounts: a demat account and a trading account. A demat account, also referred to as dematerialised account, stores shares and other securities in virtual form instead of tangible records. This account lets you conduct purchases and sales of securities on the exchange.
For intraday trading, both accounts are essential and are often opened together as a 2-in-1 account by a stockbroker.
The procedure for opening these accounts involves selecting a stockbroker registered with the Securities and Exchange Board of India (SEBI). The core considerations when choosing a broker include their brokerage fees, the quality of their trading platform, and customer service. After choosing a broker, you must complete the Know Your Customer (KYC) procedure. Completion of this procedure is mandatory by law to ensure authenticity by requiring proof of both identity and address.
The necessary documents required generally include proof of identity (PAN card is mandatory), proof of address (like an Aadhaar card or utility bill), proof of income (such as a bank statement, required for derivatives trading), and proof of a bank account (a canceled cheque). Once these documents are submitted through an online or offline application, the broker verifies the information. Following successful verification, the trading and Demat accounts are activated, and the trader can transfer funds to begin trading.
Step 2: Learn the Basics of Price Movements
Understanding the basics of price movements is a cornerstone of intraday trading for beginners. Price fluctuations are driven by supply and demand, which in turn are influenced by market news, economic data, and overall sentiment. To understand these price changes, day traders mainly depend on technical analysis.
Technical analysis evaluates security by looking at data from past price actions and trading volumes. The core principles include:
- Trends: Prices move in trends, which can be upward (uptrend, marked by higher highs and higher lows), downward (downtrend, with lower highs and lower lows), or sideways (a range-bound market). Identifying the prevailing trend is a foundational step for any trading decision.
- Support and resistance: These represent critical price levels in the market. Support indicates a price floor created by increased buying pressure. Resistance marks a level where sellers become active enough to limit further upward movement.
Traders use these boundaries to plan their entries and exits. - Volume: This refers to the number of shares traded in a given period. High volume accompanying a price move suggests strength and conviction behind the move, making it more significant. A breakout from a key level on high volume is a more reliable signal than one on low volume.
- Volatility: The indicator tracks the extent of changes in market prices. Rapidly volatile shares create more earning potential but also amplify the chance of loss.
Step 3: Choose the Right Stocks for Day Trading
The foundation of successful day trading lies in selecting the right stocks. More than 70% of intraday trading losses are attributed to poor stock selection. Ideal stocks for day trading are those with high liquidity, which ensures you can enter and exit trades easily without significant price slippage, and adequate volatility, which provides the price movement needed to generate profits. Manually scanning the entire market to find stocks that meet these criteria can be a time-consuming and inefficient process.
This is where you can analyse using stock market ai to find the right stocks much faster. AI-powered tools like Stoxo are designed to do the heavy lifting for you. A trader can simply use a direct prompt to get a filtered list of potential stocks for the day.
For example, when asked to “Show me stocks that are good for intraday trading today with high volume and price movement,” it gives you a ready list.
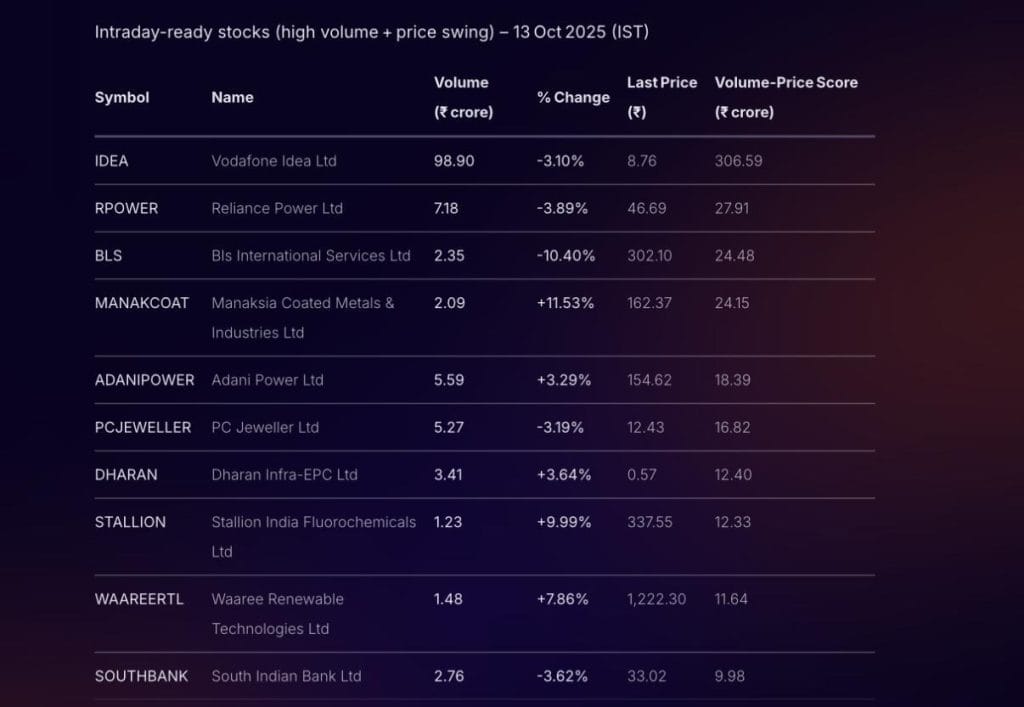

As you can see, Stoxo doesn’t just give you a list; it also explains why those stocks are good choices. It shows that the stocks fit the main criteria for day trading, like having high trading volume, big enough price swings, and staying within normal trading limits. This AI analysis saves a ton of time and gives you quick, hand-on tips based on real data.
Step 4: Use Charts & Technical Indicators
Charts and technical indicators are the essential tools of an intraday trader. Candlestick charts visually map price fluctuations, showing how values evolve throughout a trading period. Each candlestick shows the opening, highest, lowest, and closing prices for a chosen time slot (e.g., 5-minute, 15-minute).
To make better use of chart analysis, intraday traders indicators apply mathematical tools built on price and volume inputs to refine their analysis. These indicators help to confirm trends, measure momentum, and provide trading signals. Common indicators include:
- Moving averages (MA): These indicators simplify erratic price data so traders can better identify consistent trends. SMA (simple moving average) reflects the overall mean, and EMA(exponential moving average) prioritises newer price movements for quicker trend insight. When a short-term average moves above or below a long-term one, traders treat it as a potential shift in trend direction.
- Relative strength index (RSI): The Relative Strength Index (RSI) is a tool that measures recent price changes to spot if a stock is overbought and likely to fall, or oversold and likely to rise. The indicator oscillates between 0 and 100, values above 70 often imply that prices could cool off, while readings below 30 hint at a possible rebound.
- Moving average convergence divergence (MACD): Built to highlight changes in the intensity, movement, and persistence of market trends. It compares two EMAs and displays them with a signal line and a histogram to show the distance between them. Crossing above the signal line shows growing upward strength and may prompt a buy, whereas falling under it can serve as a sell indication.
- Bollinger bands: This tool consists of three lines that create a dynamic channel around a stock’s price. The middle band is a moving average, with the upper and lower bands placed a set distance away to show volatility.
Wider bands signal higher volatility, whereas narrower ones show calmer market conditions. Prices touching the outer bands can signal that a security is trading at an extreme, potentially hinting at a reversal.
Step 5: Set Entry, Exit & Stop-Loss Levels
Disciplined trading requires a clear plan for every trade. The core intraday trading rules revolve around pre-defining entry, exit, and stop-loss levels to manage risk and remove emotion from decision-making.
- Entry level: The entry point marks the exact price where a trader opens a position.
The decision to enter a trade should be based on a predefined strategy and confirmed by technical analysis, such as a breakout above resistance or a bounce from support. - Exit level (target price): The target or exit point defines where a trader plans to close the position profitably. The target price should be set before entering the trade, based on factors like the next level of resistance or a favorable risk-to-reward ratio. Setting clear targets prevents turning a winning trade into a loss due to greed.
- Stop-loss level: A stop-loss order limits potential losses if the market moves against your position. It’s placed to cap losses by closing the position when a specified price level is reached. If you’re buying a stock (long), you set the stop-loss below a support area. If you’re selling (short), it goes above a resistance area. A non-negotiable stop-loss protects capital and is essential for sustaining long-term trading.
Step 6: Apply Intraday Strategies
Traders use various intraday trading strategies to make money in the market. The ideal strategy depends on market behavior and each trader’s comfort level. Common strategies include:
- Momentum trading: This strategy focuses on stocks that are moving with significant momentum, either up or down, often on the back of news or high volume. The core idea is that a strong-moving asset tends to continue in the same direction. This method involves spotting stocks with a strong directional trend and staying in the trade until a reversal seems imminent. They use indicators like RSI and MACD to gauge the strength of the momentum before entering a trade.
- Breakout trading: The breakout strategy involves trading when a stock’s price pushes decisively through a known support or resistance level. A break higher than resistance typically denotes bullish strength, while a fall below denotes bearish momentum. Traders identify stocks moving strongly and hold them until signs of reversal appear.The strategy aims to capture the initial burst of volatility that follows the break.
- Scalping & quick trades: Scalping is a high-speed trading method targeting minor fluctuations for repeated profits. Scalpers execute numerous trades, holding positions for seconds or minutes. The objective is to gather small, frequent gains consistently. This strategy demands intense focus, quick decision-making, and access to a fast and reliable trading platform with low transaction costs.
Conclusion
The steps in this guide are the basic building blocks. The next phase is about putting this information into a consistent routine. This is how the knowledge of how to do intraday trading turns into a regular process. Building this kind of habit is a key part of handling the market’s daily movements.
FAQs
The basic rule of intraday trading is to buy and sell shares within the same trading day, avoiding overnight exposure. Strict risk management with predefined entry, exit, and stop-loss levels is crucial. Discipline and adherence to a tested strategy help limit losses and lock in profits.
You can start intraday trading with a minimum amount depending on the brokerage margin provided. Adequate capital is necessary to manage margin requirements and facilitate multiple trades, but beginners should start small to limit risk while learning.
Momentum trading is often recommended for beginners due to its focus on stocks showing strong price moves with volume support. It’s straightforward and leverages short-term trends. Breakout trading is also a simple starter strategy involving entering positions during price moves beyond key support or resistance.
Select stocks with high liquidity and sufficient volatility to ensure easy entry and exit with substantial price movement. Using AI-powered tools like Stoxo can help scan the market for stocks exhibiting high volume and notable price changes suitable for intraday trading.
Common intraday indicators include Moving Averages (SMA, EMA) for trend direction, RSI for momentum and overbought/oversold conditions, MACD for trend confirmation, and Bollinger Bands for volatility observations. These indicators assist in timing entries, exits, and identifying momentum strength.
Intraday trading can be profitable daily, but consistent profits require discipline, strategy, and risk management. Market volatility offers opportunities, yet losses are common without a structured approach. Beginners should focus on learning and practice before expecting regular profits.
AI tools assist intraday traders by quickly analysing vast market data, identifying high-probability stocks based on volume and price movement, providing real-time insights, and reducing decision-making time. These tools enhance accuracy and efficiency for traders in fast-moving market environments.

Leave a Comment