
Every stock dances differently to the market’s rhythm, while some move in sync, others break into their own beat. This rhythm is captured by a single metric known as beta, which shows how sensitive a stock’s price is to market fluctuations.
The beta (𝛃) is a metric to measure the price volatility of a stock in comparison to the market. Knowing how to find beta of a stock is essential for analysing whether a stock is defensive, aggressive, or moves independently of market trends.
In this blog, traders or investors can learn ‘what is beta of stock’, ‘how to calculate beta of a stock’ using different methods, including AI tools like Stoxo, and much more.
What is the Beta of a stock?
Beta (β), also termed as market beta, is a financial metric that measures the increase or decrease in the price of a stock, that is, price volatility, or risk compared to the market.
When the beta is 1,the stock’s price moves with the market. A beta above 1 indicates greater volatility, and a beta below 1 indicates lower volatility. Beta enables investors to measure risks associated with a stock and how it might perform during the market ups and downs.
Why Beta Matters for Investors & Traders
- Risk assessment: The beta of a stock provides a quantitative measure of its volatility and indicates how it reacts to market fluctuations.
- Aligning with risk tolerance: The beta helps the investors and traders to match their investment choices with their individual risk preferences. For example, an investor with low-risk tolerance might go for low-beta stocks, while a high-risk tolerance investor might prefer high-beta stocks for higher growth potential.
- Expected return calculation: The beta is an important part of the Capital Asset Pricing Model (CAPM), which estimates the returns of a stock based on its risk in the market.
How to find the Beta of a stock: Quick Methods
Finding the beta of a stock can be conducted using methods like using financial websites for quick access to information, calculating in Excel, or using automated tools like Stoxo.
Method 1: Pull Beta from Financial Websites
It is the quickest method to find the beta of a stock. Traders can simply navigate to a reputable financial website. Then enter the stock’s ticker symbol in the search bar, and find the beta value in the summary statistics section.
Method 2: Calculate Beta Manually in Excel
The investors can calculate the beta using spreadsheet programs like Microsoft Excel or Google Sheets. This method requires historical price data for the stock and its index.
Investors can download the historical data sheets from any of the above-mentioned sites or other reputable sites for a period of time, say 5 years. Then, using the SLOPE function or regression tool, on the percentage returns of the stock and the market index, the investors can calculate the beta.
- For using the SLOPE function, the traders need to first use the formula [=(Current Price – Previous Price)/Previous Price] to find the percentage returns for each period.
- Next, in a separate cell, they need to enter the formula [=SLOPE(known_ys, known_xs)].
- In this formula, known_ys represents the range of percentage returns of the stock, and known_xs represents the percentage returns on the index.
Method 3: Use an Automated Tool (Stoxo AI)
The investors can also use AI assistants like Stoxo, which can analyse historical data and present information with natural language commands. The following example is the result shown by a simple prompting in Stoxo:
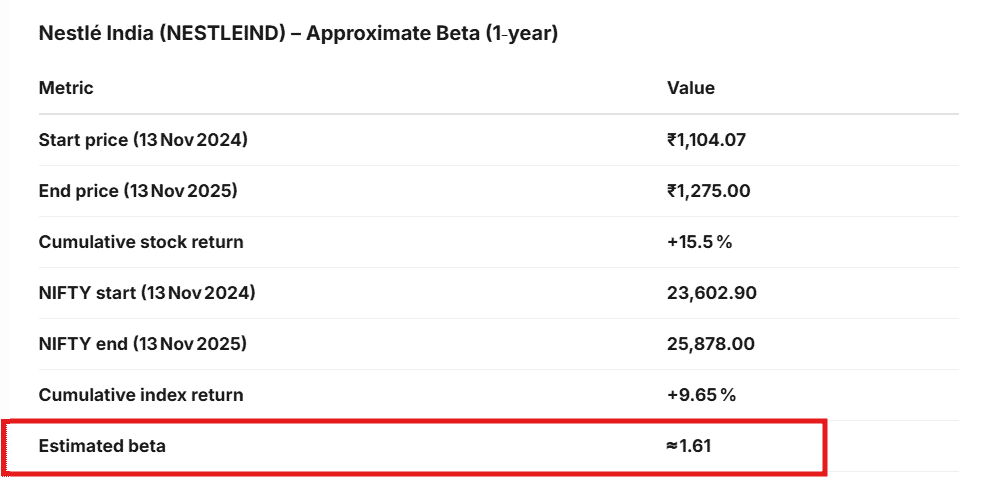
So, based on Stoxo’s analysis, Nestlé India shows an estimated beta of around 1.61 for the one-year period from November 2024 to November 2025.
The result shows that the stock’s return of over 15.5% was higher than the NIFTY’s return of over 9.65%, showing that Nestlé India outperformed the market during this time. Its beta, 1.61, indicates that Nestlé India is more volatile than the market and for every 1% move in the NIFTY, Nestlé India’s price historically moved about 1.61% in the same direction.
Step-by-Step: Calculating Beta for an Indian Stock
Let’s see how the beta can be calculated using Nestlé India (NESTLEIND) and the NIFTY 50 index, from the Stoxo result mentioned above.
Step–1: Gathering Historical Data
Let’s take the 1-year data from November 2024 to November 2025 for Nestlé India and NIFTY 50:
| Nestlé India start price | ₹1,104.07 |
| Nestlé India end price | ₹1,275.00 |
| NIFTY start | 23,602.90 |
| NIFTY end | 25,878.00 |
Step–2: Calculating Returns
Percentage Returns = (Current Price – Previous Price)/Previous Price x 100
Nestle India Returns = (₹1,275.00 – ₹1,104.07)/₹1,104.07 x 100 = 15.5%
Nifty Returns = (25,878.00 – 23,602.90)/23,602 x 100 = 9.65%
Step–3: Calculate Beta
Beta = Percentage Returns on Stock/Percentage Return on Index
So here Beta = 15.5%/9.65% = 1.61% approximately.
How to Interpret Beta Value (≤1, >1, negative)
This breaks down the interpretation of the beta value. Check out to learn!
| Beta ≤ 1 | A beta less than 1 indicates that the stock is less volatile than the market and moves more slowly and in smaller magnitudes. |
| Beta = 1 | A beta equals to 1 indicates the stock’s movement mirrors the market. |
| Beta > 1 | A beta above 1 indicates the stock experiences higher volatility than the market. |
| Beta = Negative | A stock with a negative beta usually moves in the opposite direction of the market. |
Limitations & Pitfalls of Using Beta
- Backward-looking: The beta is calculated using past data, which does not guarantee future performance, as market conditions and company performance could change.
- Measures only systematic risk: The beta only accounts for market risk, that is, systematic risk, and not company-specific risk like management issues, high debt, or lawsuits, which could also impact stock prices.
- Doesn’t guarantee returns: The beta indicates volatility, meaning the stock price will swing in response to market movements, but this can also mean large losses and even large gains.
Using Beta in Your Strategy: Portfolio, Derivatives & Risk
The beta is an important metric for quantifying and managing the relationship between a single asset or portfolio and the market.
- Portfolio Strategy: Beta helps the investors to build their portfolios with alignment to their risk tolerance. A portfolio with a beta close to 1 will generally move with the market, while a portfolio with a beta less than 1, for example, in the case of utility stocks, is considered more defensive, and a portfolio with a beta greater than 1, for example, technology stocks, is more aggressive.
- Derivatives Trading: Beta is used to size derivative positions for hedging or speculation. For example, if an investor has a high-beta stock portfolio and wants to reduce market risks, they might short, which means selling first and buying later, Nifty futures in proportion to the portfolio’s beta value.
- Risk Management: Beta is central to the CAPM, which is a fundamental tool for estimating the potential return of an asset given its market risk. It helps the traders and fund managers to measure performance more accurately to make effective investment decisions.
Conclusion
Beta is an important indicator of how a stock moves with the market. Its strength lies in helping the traders and investors to understand the market volatility, manage portfolio risk, and build strategies suited to their risk tolerance.
However, since beta is based on past data and overlooks company-specific factors, combining it with fundamental analysis, diversification, and regular review of market trends will ensure better decision-making. If it is used wisely, beta becomes a guide, not a guarantee, for moving across the ever-changing market.
FAQ‘s
Beta can be calculated by dividing the stock’s percentage returns by the percentage returns of the market index. It measures how much a stock’s returns move compared to the market returns.
Beta can be calculated in Excel by using the SLOPE function on the percentage returns of the stock and the market index: Beta =SLOPE(stock returns, market returns).
Beta helps the traders to understand how much risk or movement their portfolio holdings have compared to the market. It guides portfolio balancing and helps in sizing hedging positions using options or futures contracts.
A beta above 1 means the stock is more volatile than the market. If the market moves 1%, the stock is expected to move more than 1% in the same direction.
Beta should be reviewed periodically, especially when the market conditions or the company fundamentals change, as the past data may not always reflect the current volatility.
Yes, a stock can have a negative beta, and it means the stock moves in the opposite direction of the market. These stocks are rare and can be used as a hedge during market downturns.

Leave a Comment