
In India, stock market data analysis has become important to understand how markets move and how investors react. By the end of 2024, NSE listed companies’ market cap was around 5.13 trillion, up 21.5% from last year. With so much growth, the amount of data to study has also increased. This guide covers the main methods, tools and challenges in stock market data analysis. So, let’s get to it!
What Is Stock Market Data Analysis?
Stock market data analysis is the process of examining historical and live financial data to make informed investment decisions. It involves applying analytical and statistical methods to uncover patterns, behaviours, and possible opportunities in the stock market.
By interpreting metrics like price movements, trading volume, and corporate earnings, analysts aim to forecast future stock performance and manage risk. This discipline transforms vast amounts of raw market information into actionable insights for traders, investors, and financial institutions.
Types of Stock Market Data
To do a thorough analysis, investors and analysts rely on a lot of information which can be categorised into several types, including:
- Fundamental data
This category includes all information related to a company’s financial health and intrinsic value. It covers metrics from financial statements such as revenue, net income, earnings per share (EPS), and price-to-earnings (P/E) ratios. It also encompasses qualitative factors like the company’s business model, competitive advantages, management quality, and overall industry health. The goal of analysing fundamental data is to determine a stock’s true worth, separate from its current market price.
- Technical data
This type of data pertains exclusively to a stock’s historical trading activity. It covers data such as price movements (open, high, low, close), trading volume, and computed indicators like moving averages and RSI (Relative Strength Index). Technical analysts use this data to identify chart patterns and trends, believing that past trading activity can provide clues about future price movements without regard to the company’s underlying financial performance.
- Market sentiment data
The data captures the collective outlook or emotion of investors regarding a specific stock or the overall market direction. It can be gathered from various sources, including news headlines, social media posts, analyst ratings, and investor surveys. For example, a surge in positive news articles or bullish social media mentions can indicate positive sentiment, which might precede a price increase.
Approaches to Stock Market Data Analysis
Investors and analysts use various distinct methodologies to interpret market data and inform their strategies, such as:
- Fundamental analysis: This approach involves evaluating a security’s intrinsic value by examining related economic and financial factors. Analysts examine a company’s financial reports, reviewing its assets, debts, revenue, and cash inflow. They also consider broader economic conditions, industry trends, and the quality of the company’s management. The main goal is to identify whether a stock is priced higher or lower than its actual value, making it a preferred approach for long-term investors.
- Technical analysis: This analysis method refers to studying statistical patterns derived from past trading records, including price action and trade volume. Practitioners of technical analysis assume that every relevant factor is already embedded in a stock’s price and that previous price behaviours tend to recur. They use charting tools and technical indicators to identify trends and patterns, like support and resistance levels or moving average crossovers, to forecast future price direction. This methodology is adopted by short-duration traders.
- Quantitative analysis: This approach utilises mathematical and statistical models to analyse data and identify trading opportunities. Quants, as these analysts are known, build complex algorithms to test hypotheses and execute trades based on predefined criteria. This system minimises emotional bias in trading decisions and often requires examining large volumes of data to uncover hidden relationships or signals not easily visible through standard analysis methods.
Machine Learning & AI in Stock Market Data Analysis
Artificial intelligence is becoming central to financial markets, with the algorithmic trading market expected to reach $28.44 billion by 2030. The use of AI in stock market analysis mainly focuses on enhancing prediction accuracy.
- Improved predictive accuracy
Machine learning models analyze historical data, patterns, and correlations that are often invisible to human analysts. While they do not guarantee results, studies show these models can forecast short-term market direction with an accuracy of around 70–80%. Even a few percentage points above random guessing can create a significant advantage when applied across large volumes of trades, especially in algorithmic and systematic strategies.
- Speed and data processing power
AI systems excel at handling massive datasets with speed unmatched by humans. Reports show that AI can process and act on information up to 1,000 times faster. This makes high-frequency trading possible, where algorithms exploit microsecond-level price differences across markets. Such speed allows firms to react instantly to market signals, news, or order book changes, giving them a competitive edge.
- Access for retail investors
AI tools are no longer limited to big institutions. Modern trading platforms now offer AI-powered features like pattern recognition, portfolio optimization, and predictive analytics in simplified interfaces. This makes advanced analysis accessible to individual investors, enabling them to make data-informed decisions without needing in-house research teams.
Sentiment & News Data in Stock Analysis
Unstructured data like news analysis using AI and social media now plays a major role in market research. By tracking public sentiment, investors can spot signals that influence price action.
- Strong link with market moves
Public mood often translates into buying or selling activity. Academic research, such as a University of Michigan study, found that Twitter sentiment could predict the Dow Jones’ daily direction with up to 87.6% accuracy. This demonstrates that crowd psychology and real-time opinions can strongly correlate with price shifts, making sentiment a valuable early indicator.
- Large-scale real-time processing
AI-powered Natural Language Processing (NLP) tools now scan over two millions of news articles, reports, and posts every day. Financial data providers like Refinitiv assign sentiment scores positive, negative, or neutral to each item. These scores help flag news that could affect stocks within minutes, sometimes before the information is fully reflected in prices.
- Improved strategy performance
Studies show that adding sentiment data into trading models enhances profitability. Strategies that combine traditional indicators like price and volume with news-based sentiment analysis often see 5–10% higher returns. This improvement comes from incorporating behavioral insights alongside numerical data, giving traders a broader perspective on market drivers.
Step-by-Step Process to Analyse Stock Market Data
A structured approach is essential for effectively analysing stock market data, which typically involves the following steps:
- Collecting & Cleaning Stock Data
The first and the foremost step involves sourcing dependable and relevant market information. This includes historical price data (OHLC), trading volumes, fundamental data (P/E ratio, EPS), and alternative data like news sentiment. Data can be sourced from financial APIs, stock exchange websites, or data vendors. After collection, the dataset needs to be refined to correct missing fields, inaccuracies, or irregularities. For example, a stock split can create sudden price drops that need to be adjusted to avoid misinterpreting them as market crashes. A clean and accurate dataset is the foundation for any meaningful analysis.
- Indicators
With a clean dataset, the next step is to compute technical indicators and financial ratios. Technical indicators like the relative strength index (RSI), moving averages (MA), and MACD are calculated from price and volume data to measure momentum, trends, and volatility. At the same time, fundamental ratios such as price-to-book (P/B) and debt-to-equity are computed to evaluate the firm’s overall financial condition. These indicators transform raw data into structured signals that can be used to form hypotheses about future market behavior.
- Modeling & Prediction
This is where predictive models are built using the calculated indicators as input features. The goal is to forecast a target variable, such as the future price or direction of a stock. The applied methods can vary from basic models like linear regression to advanced AI systems such as LSTM (Long Short-Term Memory) networks, particularly effective for sequential data. The process of stock market data analysis using ai is particularly influential here, as AI models can identify non-linear relationships and complex patterns in the data, leading to more nuanced and potentially accurate predictions.
- Backtesting & Validation
Before implementing a model in live trades, it must undergo detailed evaluation using past market records. This process, called backtesting, recreates how the model’s strategies might have functioned historically. Important measures of performance include overall gain/loss, Sharpe ratio (risk-adjusted performance), and maximum drawdown. A strong backtesting outcome indicates that the model is reliable and not simply tailored to past data irregularities. If the model performs well, it can then be validated on up-to-the-minute data before being considered for everyday application.
Tools & Platforms for Stock Market Data Analysis Visualisation & Dashboards
From APIs for deep customisation to AI-driven platforms that answer questions directly, the tools available for stock market data analysis cater to every type of investor. Here’s some of the platforms to use:
- Zerodha Kite Connect: Provides an API suite for developers to build custom trading and analysis platforms using live and historical market data for deep backtesting.
- Upstox API: Offers programmatic access to market data, enabling traders to create personalised analysis applications and deploy automated algorithmic strategies.
- StockEdge: Simplifies data analysis through an integrated platform with pre-built screeners and visual dashboards for tracking key technical and fundamental indicators.
- Trendlyne: Delivers comprehensive stock analysis with detailed financial visualisations, advanced screeners, and proprietary scoring models to evaluate company performance.
- Stoxo: Stoxo AI functions as a conversational AI research partner that synthesises scattered market data. It allows users to ask complex questions directly and receive credible, true-time intelligence, bypassing traditional manual research methods.
Use Cases & Real-Life Examples
To see how these modern tools work can help make the process simpler and speedier, we tested Stoxo with a direct prompt. We asked it to compare two major companies from different sectorsTata Steel and Infosys, to see how it would synthesise diverse data points in real-time.
When asked to “Perform stock market data analysis for on Tata Steel and Infosys” the tool gave the following response:
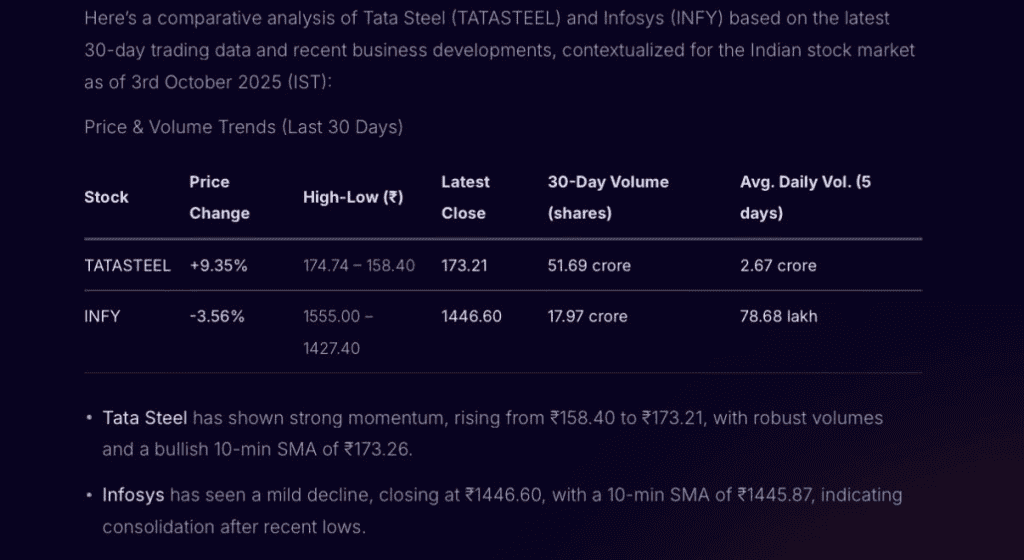
In just a few seconds, the AI delivered a multi-layered summary comparing technical price trends, crucial business developments, and overall market sentiment for both stocks. This demonstrates the power and simplicity of modern analysis tools; a single, straightforward question generated a comprehensive snapshot that would have traditionally taken hours of manual research across different financial reports and news sources.
Challenges & Limitations
While data analysis is a powerful tool, investors must be aware of its inherent challenges and limitations, which are:
- Information ambiguity
It arises when identical data points are interpreted differently by various market participants. For example, a company acquiring another firm could be seen as a positive sign of growth by one analyst but as a risky, debt-increasing move by another. This subjectivity can lead to contradictory conclusions from the same dataset, making it difficult to determine the “correct” interpretation.
- Biased information sources
Information is not always neutral. Companies, in their annual reports and press releases, often present data in a way that highlights their successes while downplaying their weaknesses. Similarly, analysts may have underlying biases depending on their employer’s relationships or their personal beliefs. Investors must critically assess the source of the information and be aware of potential spin.
- Market irrationality
Data analysis often assumes that markets and investors behave rationally. However, markets can be driven by emotion, speculation, and herd behavior, causing prices to deviate significantly from their fundamentally justified values. Events like market bubbles or panics show that prices can remain irrational for extended periods, overriding what the data might suggest. No analytical model can perfectly predict the impact of human psychology on market movements.
Conclusion
Stock market data analysis is no longer merely about numbers, it’s about connecting information, behavior, and technology to gain better understanding. With smarter tools and AI-powered platforms, investors today can decode markets faster and with more depth than ever. The real edge lies in how well you turn raw data into practical insights that guide action.
FAQs
Stock market data analysis requires price data (open, high, low, close), trading volume, historical price trends, and financial metrics like earnings and dividends. Additional data may include news sentiment, economic indicators, and company fundamentals to provide a well-rounded view of market conditions.
Free stock market data is often scattered across different websites, making it harder to piece everything together. Instead of jumping between multiple platforms, some users prefer using a single place where the data is simplified and structured. Tools like Stoxo offer such a space, where market updates, price movements, and analysis come together in an easy-to-read format without extra cost.
Feature engineering transforms raw stock data into meaningful inputs for models, like moving averages or volatility metrics. It improves model accuracy by highlighting relevant patterns, trends, and relationships that original data alone may not reveal, making predictions more reliable.
Avoid overfitting by using a separate testing dataset, cross-validation, and keeping models simple. Overfitting happens when a model matches past data too closely, failing to generalise to new data. Regular updates and avoiding too many variables help maintain model robustness.
Yes, news and sentiment data capture market mood and reactions which aren’t always reflected in price history. Incorporating them can enhance forecasts, especially for short-term moves or volatile stocks, by providing real-time insights into investor behavior and market psychology.
Forecasting tasks typically use metrics like mean absolute error (MAE), root mean square error (RMSE), and R-squared for continuous outcomes. Classification tasks use accuracy, precision, recall, F1-score, and ROC-AUC to judge how well categories or signals are predicted.
A minimum of 3-5 years of historical data is recommended for meaningful trend analysis. More data improves reliability but also risks including obsolete patterns. Balancing recent relevance with sufficient historical context helps in model accuracy and informed decision-making.
Stock market data analysis is valuable for both. For long-term investing, it helps assess fundamentals, identify undervalued stocks, and understand market cycles. For traders, it aids in timing entry/exit points using technical signals. Combining both approaches can optimise investment strategies.

Leave a Comment