
The Indian equity market has had a difficult year in 2024, with correction and pressure from US tariffs and weak earnings. However, the strong policy push from the major GST revamp cuts repo and CRR, aiming to ease inflation and fuel demand, while improving the market scenario.
In this environment, where policies, valuations, and earnings are constantly shifting, stock portfolio analysis is more than just metrics. It’s a tool for investors to understand how their investments respond to market uncertainty. Stock portfolio analysis provides insights into risks and opportunities, which enable investors to align their investments.
This blog gives an overview of the key metrics, tools, and step-by-step methods to evaluate returns, measure risk, benchmark performance, and analyse a stock portfolio, and much more, for investors to uncover vulnerabilities in their portfolio.
First, What is a portfolio?
A portfolio is a collection of investments held by an investor or an institution. It could include financial instruments like stocks, bonds, or funds.
What Is Stock Portfolio Analysis?
Portfolio analysis allows investors to evaluate and measure the performance of their portfolio using performance metrics which are aligned with financial goals. The primary goal of stock portfolio analysis is to measure performance while identifying risks associated with the stocks.
Why Does Stock Portfolio Analysis matter?
Portfolio analysis gives investors a clear view of how their decisions provide results and how to direct their goals.
- Clear view of performance and risk: Stock portfolio analysis provides investors with insights regarding how each asset in the class performs and the risks associated with it. For example, an investor might notice that their tech sector stocks are steady, but the auto stocks are relatively volatile.
- Better asset allocation: The regular reviews help the investors to mix stocks or sectors to meet their portfolio objectives more efficiently and effectively. For instance, if the tech stocks’ value rises, adding some FMCG stocks to the portfolio could bring stable returns.
- Identify drivers of returns: Portfolio analysis highlights which holdings or decisions contribute most or least to the portfolio’s performance, while improving strategies and future decision-making. For example, an investor might notice that the IT services are driving gains, while the power sector holdings give slow returns.
- Control over costs: Portfolio analysis supports investment decisions by enhancing cost optimisation by considering transaction and ongoing management charges. For instance, shifting from a high-cost mutual fund to a lower-cost ETF could improve overall returns.
Key Objectives: Stock Portfolio Analysis
The portfolio analysis states if the portfolio performance aligns with its expectations over a specified period, assesses the level of risk assumed, and the attribute returns.
- Provide Stability: It provides insights on whether the portfolio is achieving capital appreciation in comparison to the given inflation, while maintaining consistent returns.
- Risk and Diversification: It evaluates whether the asset allocations match the risk appetite of the investors, identifies investment concentration, and helps to diversify assets across sectors.
- Tax and Marketability Efficiency: Portfolio analysis reviews how different assets affect returns after tax and ensures holdings are liquid enough and are actively traded to avoid being locked in.
- Alignment with Long-Term Goals: It assesses whether the portfolio structure and its direction support long-term objectives, for example, funding the pension of the investors.
Core Metrics for Stock Portfolio Performance analysis
Investors can understand portfolio performance and conduct portfolio risk assessment by examining returns, risk, and benchmarking metrics. Stock market AI speeds such analysis, unearths patterns and hidden risks, enabling precise and faster decisions.
Total Return vs CAGR vs Annualised Return
| Aspects | Total Return | CAGR |
| Objective | Total returns, also known as Absolute Returns, shows the total return on the overall investment irrespective of the holding period. | CAGR or Annualised Returns, shows yearly returns on investment for specific holding period, while assuming profits are reinvested. |
| Formula | =[(Total Investment/Initial Investment)-1] x 100 | ={(Ending year value/ Beginning year value) ^ (1/n-1)} x 100 |
| Benchmark | No benchmark set. | CAGR is usually compared to benchmark or index. |
| Accuracy | It is less accurate for comparing long term investments. | It provides more accurate and comparable data, along with earning percentages. |
| Suitability | It is used for calculating return on investment (ROI) in case of short-term investments. | It is used for calculating return on investment (ROI) in case of long-term investments. |
Risk Metrics: Standard Deviation, Beta, Maximum Drawdown
- Standard Deviation: Standard deviation determines the deviation between the actual return and its expected return over the investment period. It is an indicator of risk. For example, a higher standard deviation means higher risk, and a lower standard deviation means lower risk.
Standard Deviation = √[ Σ (R – R_mean)² / n ]
Where:
R = individual return, R_mean = average return, n = number of observations
- Beta: Beta measures the price volatility of an investment or portfolio in comparison to the market. It is calculated by comparing returns to the benchmark index returns. Beta can range from negative 1 to positive infinity. For example, if a portfolio has three different stocks in whose betas are 0.5, 1, and 2, the overall portfolio beta will be 1.4 [βp = (w₁ × β₁) + (w₂ × β₂) + (w₃ × β₃) = (⅓ × 0.5) + (⅓ × 1.0) + (⅓ × 2.0)]
β = Cov(Rp, Rm) / σm²
Where:
Rp = return of the portfolio, Rm = return of the market, Cov(Rp, Rm) = covariance between portfolio return and market return, σm² = variance of the market return
- Maximum Drawdown: Maximum drawdown shows the maximum drop in the price of a stock. It measures risk and uncertainty, and also indicates the recovery period after such a drop or decline. Maximum drawdown could range from 0 to 100%, while higher values mean greater loss.
Maximum Drawdown = {(Peak – Trough)/ Peak}
Where,
Peak = Highest portfolio value during a period, Trough = Lowest portfolio value after peak and before recovery
Risk-Adjusted Metrics: Sharpe, Sortino, Treynor, Information Ratio
Sharpe: Sharpe ratio is a portfolio risk assessment metric used for evaluating returns of a portfolio or investment. It compares the returns of an investment against its risks, calculated through the standard deviation of returns. Sharpe ratio is usually a positive value or even zero.
A higher Sharpe ratio may indicate higher returns for the undertaken level of risk.
Sharpe Ratio = (Rp – Rf) / σp
Where: Rp = Portfolio return, Rf = Risk-free rate of return, σp = Standard Deviation of the portfolio’s excess return
Sortino: The Sortino ratio assesses returns by using downside deviation. It measures returns below a particular target or minimum acceptable level.
A higher ratio often indicates better returns, while a lower ratio suggests lower returns for downside risk.
Sortino Ratio = Rp – Rf/ DD
Where: Rp = portfolio return, Rf = risk-free rate, DD = downside deviation
Treynor: The Treynor Ratio evaluates market risk using beta. It is ideal for measuring investments or diversified portfolios. It helps investors to ascertain if a portfolio’s returns compensate for its exposure to market risk.
Treynor Ratio can be positive or negative, and even zero. A higher Treynor Ratio signifies better performance, indicating better returns compared to market risk.
Treynor Ratio = (Rp – Rf) / βp
Where: Rp = Portfolio Return, Rf = risk-free rate of return, βp = Portfolio Beta
Information Ratio: It evaluates a portfolio’s returns against a benchmark. It measures the excess returns generated in comparison to the benchmark and evaluates the consistency of these excess returns, and monitors error.
This ratio helps investors understand a fund manager’s capacity to generate above-average or high returns over time.
IR = Portfolio Return−Benchmark Return/Tracking Error
Where: IR=Information ratio, Portfolio Return=Portfolio return for a period, Benchmark Return=Return on benchmark fund, Tracking Error=Standard deviation of portfolio and benchmark returns.
Benchmarking & Attribution
Benchmarking measures the performance of a portfolio against a benchmark, which is usually a market index. Its goal is to determine portfolio performance compared to its competitors and identify areas for improvement or adjustments.
For example, if the benchmark is the Nifty 50 and it earned 12% while the portfolio earned 10%, it shows that it underperformed in comparison to the benchmark.
Performance attribution is a method used to draw the source of a portfolio’s returns in comparison to the benchmark. It identifies the factors that contribute to a portfolio’s performance or underperformance compared to the benchmark.
For example, a portfolio might underperform because of fewer funds in IT stocks, compared to the benchmark. Here, attribution shows that allocation of funds caused the gap in performance.
Diversification, Correlation & Asset Allocation
Diversification is a component of portfolio management. It involves the strategic allocation of investments across various assets or securities to reduce risk from a single investment. This avoids potential losses from underperforming assets, especially ones with uncorrelated price movements.
For example, a portfolio can be structured as 60% stocks and 40% bonds, or by including a mix of Indian, US, or European stocks, to minimise risk and balance returns so that losses from one investment can be overcome with the gain of another.
Correlation measures how a group of assets moves compared to each other. It focuses on selecting assets that react differently to market events, which reduces portfolio risk. It helps investors to balance returns while ensuring that all assets are not moving in the same direction.
For example, having gold in a portfolio helps to balance returns, because gold often has a low or negative correlation with stock market movements.
Asset allocation is dividing investments across various asset classes, such as equities or debt funds, which aligns with investors’ financial goals and risk tolerance. It directly influences the overall risk-return profile of a portfolio.
For example, dividing total investment into 40% stocks, 30% bonds, and 30% cash to balance returns and ensure safety from losses.
Tools, Software & Platforms for Portfolio Analysis
- Koyfin: This modern platform allows advisors to build and customize multi-asset model portfolios. It offers risk metrics such as Sharpe ratio, beta, drawdown, benchmarking, and detailed risk breakdowns.
- Portfolio Visualizer: Portfolio Visualizer provides tools for backtesting and portfolio analysis. It enables investors to test different strategies compared to historical data, analyse asset allocation, and forecast potential outcomes. This helps investors evaluate performance for different strategies before actually investing.
- Kubera: Kubera offers a comprehensive financial overview by functioning as a modern net worth and portfolio tracker. It connects with global banks, brokerages, and crypto wallets. Additionally, Kubera aids in planning and enables investors to share financial information with trusted contacts.
- Stoxo: Stoxo is a new AI stock market research engine for Indian retail investors, offering real-time updates and simplified dashboards through natural language queries, blending market trends, analyst views, sector data, and behavioral insights.
Hidden / Overlooked Risks in Portfolios
- Risk of Concentration: Portfolios that are often diversified could be concentrated in a few stocks or sectors, especially in the case of tech firms. This leads to significant losses if these stocks or sectors decline.
- Risk factor overlap: Assets could be affected by the economic factors, which affect diversification and increase the risks of correlated losses.
- Style concentration: Investors may concentrate on a particular investing style, for example, value or growth, which limits diversification despite having multiple stocks or assets.
- Hidden volatility: Portfolio returns can hide underlying risk. Portfolios with high returns, however, could carry potential risks that are not visible.
Monitoring & Rebalancing: When and How
Monitoring helps in understanding deviation in asset allocation that could result from market movements or changes in personal financial objectives. Investors should monitor their portfolio at regular intervals like quarterly or annually.
Portfolio rebalancing is often done when a portfolio deviates from its target or at regular intervals, say yearly. Usually, annual rebalancing is suggested to investors, as it provides a balance between managing risk, achieving returns, and controlling costs.
Rebalancing a portfolio includes selling investments that have exceeded their target percentages or buying investments that have fallen below the target. This restores the initial asset allocation. This process can be executed manually or through automated tools like stock analysis AI, always considering potential tax implications and transaction costs.
Case Study: End-to-End Portfolio Analysis (with Data)
- From 1995 to 2017, Yale University Endowment achieved a 13.1% annual return. This was achieved through a diversified portfolio, by allocating 55% to traditional assets and 45% to alternative investments. It reflects the effectiveness of modern portfolio theory in achieving strong returns with moderate risk.
- In June 2025, the Azim Premji Trust executed a portfolio rebalancing by selling 20.23 Cr Wipro shares in a block deal valued at ₹5,057 Cr. This move shows how portfolio analysis helps investors, avoid dependence on one stock, and align investment with long-term goals.
Investor Types: Beginners vs Advanced Strategies
For beginners:
- Beginners can diversify their investment into different asset classes or sectors.
- Use simple metrics like overall portfolio return and basic asset allocation.
- Use simple tools such as Kubera or Portfolio Visualiser for monitoring and balancing.
Advanced investors:
- Use risk optimization techniques like drawdown.
- Use advanced tools and platforms like Koyfin for detailed portfolio analysis and strategy optimization.
- Investors can integrate tax strategies to maximise returns after tax.
Global & Emerging Market Considerations
Global portfolio analysis assesses investments in developed and emerging markets, evaluates regional risks and opportunities. Emerging markets, such as India, present greater growth potential; however, include challenges like change in regulatory policies and liquidity concerns.
Investors or institutions usually integrate country-specific decisions with detailed company analysis to find quality, growing firms. They also evaluate Environmental, Social, and Governance (ESG) factors to manage risks in a better way. Effective portfolio analysis balances potential higher returns with the given and added risks of different markets.
How to Analyse Your Portfolio Step by Step
Here are the essential steps in how to analyse a stock portfolio:
- Performance Analysis: Portfolio returns shall be evaluated over time against relevant, measurable benchmarks that align with the portfolio’s investment horizon for a meaningful comparison.
- Risk Analysis: Risk analysis evaluates portfolio uncertainty or losses through metrics such as standard deviation and drawdowns. It shows stock movements compared to competitors or benchmarks.
- Risk-Return Analysis: It evaluates portfolio returns compared to the risks that are undertaken. It ensures returns are consistent, reflecting profitability at the given level of risk.
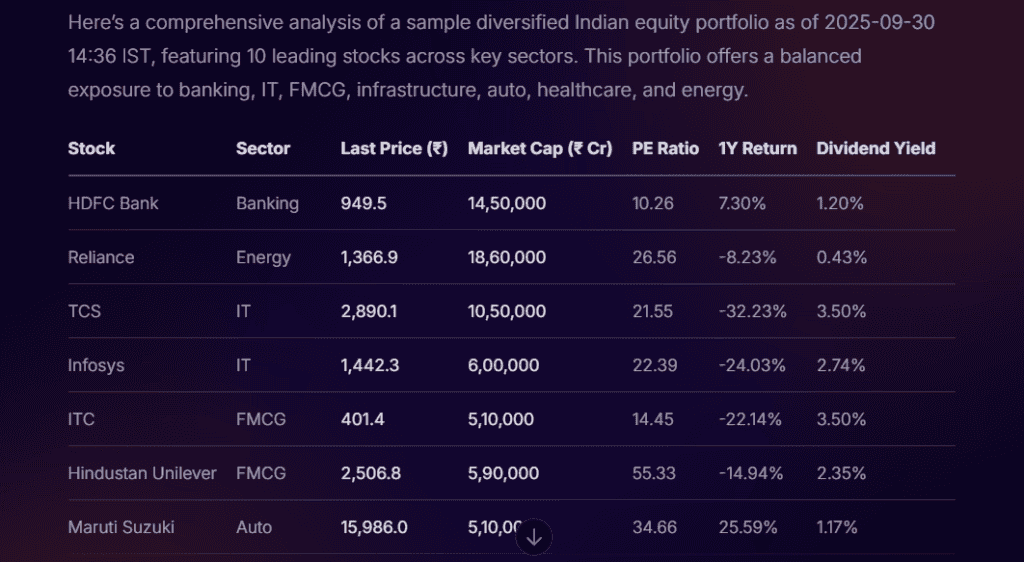
Investors can use tools like Stoxo for monitoring performance, risk, and returns. It will help investors to make faster and informed decisions without handling complex calculations by themselves.
Here’s a result shown by Stoxo, of a sample Indian equity diversification across key sectors:
Conclusion
Stock portfolio analysis helps investors evaluate the performance of their portfolios and the involved risks. Investors get clarity on whether their portfolios are meeting returns expectations and are aligned with their long-term goals by benchmarking, using different metrics, and identifying drivers of growth.
Stock portfolio analysis focuses on conducting a regular analysis that could reflect hidden risks, ensure effective allocation, and support decision-making. With tools like Stoxo and Kubera, investors can get faster insights, avoiding complexity while adapting to market changes.
FAQs
The key metrics used in stock portfolio analysis are returns, risk metrics, and risk-adjusted metrics.
You can assess risk by using metrics such as standard deviation, beta, maximum drawdown, and by rebalancing the portfolio.
Benchmarking is comparing a portfolio’s performance to a market index or fund. It determines performance by comparing it to its peers and identifies areas for improvement or adjustments.
Portfolios are suggested to be reviewed quarterly or annually. While rebalancing should be done annually or when asset allocations deviate by 5–10% from their targets.
Some hidden risks could be sector concentration, risk factors overlapping, relying on a particular style like growth or value, and hidden volatility under strong returns.
The best tools or software for portfolio analysis are Koyfin, Portfolio Visualizer, and Kubera, which provide backtesting and monitoring. Stoxo simplifies analysis for Indian investors with real-time updates and sector data.
Yes, international exposure or emerging markets carry risks such as policy changes or liquidity issues that affect portfolio performance.

Leave a Comment