According to the Asian Development Outlook, India’s economy is expected to grow by 6.5% in 2025 and 2026. However, the forecast for 2026 was cut from 6.7% to 6.5% due to the US tariffs on exports in India.
For investors, this shows the importance of analysing sectors in the stock market. As some sectors may face challenges, while others could get stronger, having proper information helps in making good investment decisions.
Read this blog to understand what stock market sector analysis is, why it matters, how to do sector analysis, and much more.
What Is Sector Analysis & Why It Matters
Sector analysis in the stock market is the process of evaluating different sectors or industries to identify opportunities and risks for investments. It studies trends, analyses performance metrics, and economic factors that affect a particular sector, say healthcare, IT, or finance. It helps investors in decision making and in allocating their capital carefully.
Why it matters:
- Data-based Decision: It helps investors to select sectors with better growth opportunities based on economic indicators.
- Diversification: It ensures investments are distributed across different sectors to reduce risk.
- Market Trend: This highlights the suitable entry or exit points based on the types of sectors.
- Performance Evaluation: It allows stock benchmarking in comparison to sector averages.
Business Cycle & Sector Life Cycle Stages
Learn about different stages of the business and sector life cycle, which helps investors to plan investments, balance risk, and choose sectors based on their performance in each phase.
Business cycle stages
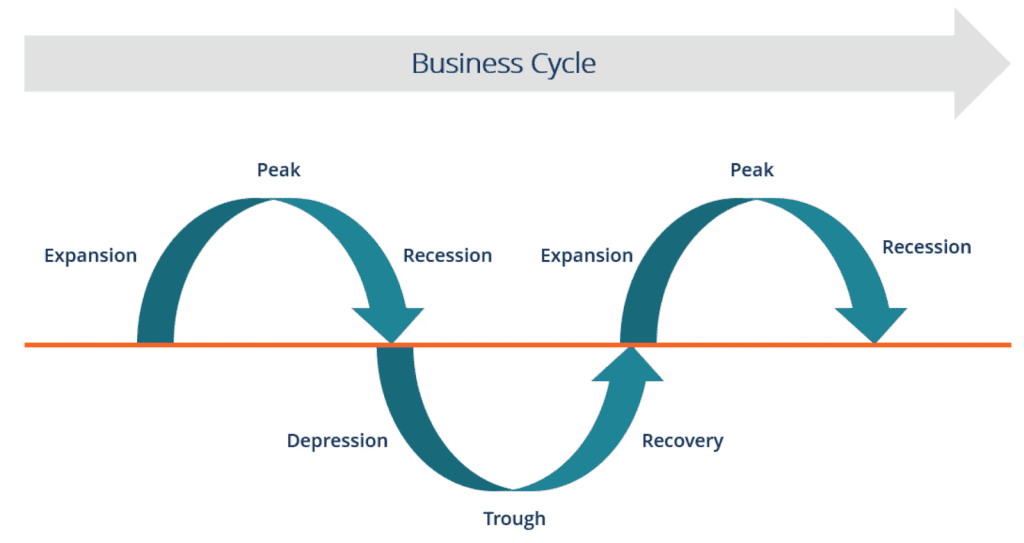
A business cycle shows the fluctuation in the Gross Domestic Product (GDP) between expansion and contraction in its long-term growth rate.
- Expansion: The first stage involves favourable economic indicators such as per capita income, investments, demand and supply. In this stage, the money supply is strong, and it continues until economic conditions stay favourable.
- Peak: Next, the economy reaches a peak in the business cycle. In this stage, maximum growth is achieved, and the economic indicators and prices stagnate at their highest.
- Recession: After the peak follows recession, where demand starts to decline. However, producers, being unaware and slow to react, continue producing, creating excess supply in the market. Due to this, prices start falling and the economic indicators become unfavourable.
- Depression: Then the economic growth continues to decline, and the curve falls below the steady growth line, which indicates depression in the economy.
- Trough: During depression, the economic growth rate falls to negative. Here, the prices, demand and supply falls to their lowest point. And by this, the economy reaches a trough marked as the negative point for an economy.
- Recovery: In this stage, the economy returns from negative to positive growth. The demand in the economy starts to rise as the prices are low and, as a result, supply increases. The public develops a favourable attitude towards investment and employment, and production starts to grow.
Sector life cycle stages
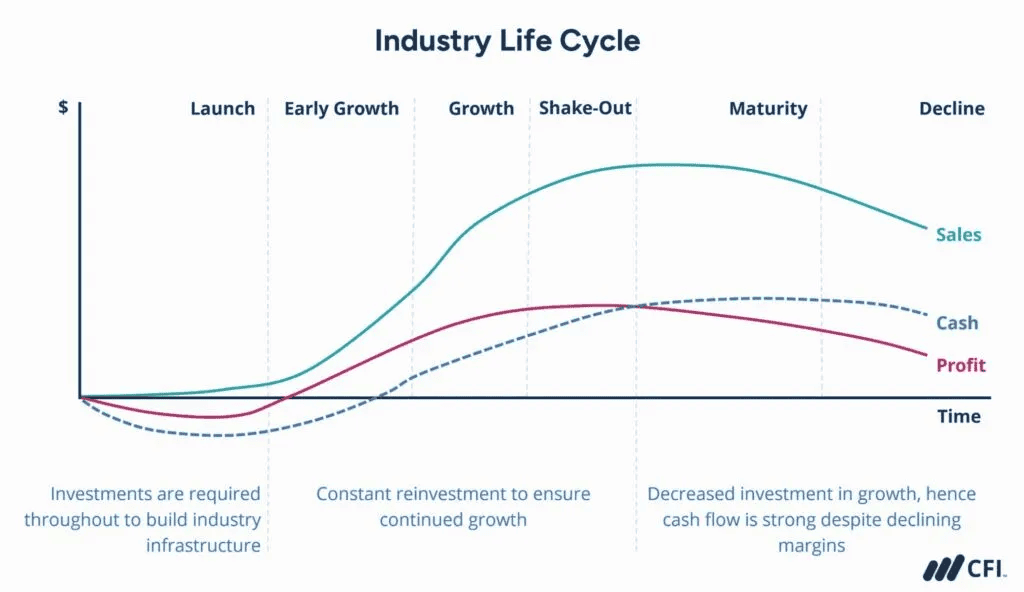
The Sector life cycle mainly has five stages, which are as follows:
- Launch: This is the starting point when an industry starts with a new technology, product, or service. It’s a pre-revenue phase for the industry while exploring economic factors and market fit. In the beginning, capital investments are made in R&D, and afterwards in marketing. During the launch phase, regulations are low as governments and regulators learn about the sector.
- Growth: In the growth phase, a sector has established market fit and commercial viability. This stage includes early and later growth sub-phases, which are defined by market size and revenue record. Competition as new entrants compete for market share.
- Shake-out: In the shake-out stage, growth slows significantly. Regulation tends to increase as understanding of the industry grows, with the established market leaders. It leads to competitors failing or merging.
- Maturity: During the maturity stage, revenue flattens or slowly declines, but businesses usually have stable margins and growing cash flow, which leads to industry concentration. Here, competition impacts the margins; however, surplus cash allows management to optimize capital structure and return capital to shareholders as dividends or stock buybacks.
- Decline: In this stage, sector revenue totally declines. Mergers and acquisitions start driving growth, which leads to higher revenue concentration. Management either reinvents the business or prioritises returning capital to shareholders. Companies in declining sectors tend to have high dividend yields and low earnings growth; any EPS growth often comes from acquisitions or financial engineering.
Key Metrics to Evaluate Sector Performance
Here are some key metrics to evaluate sector performance, and you can also simplify the analysis by using stock market AI tools.
Valuation Metrics: P/E, P/S, EV multiples
Price-to-earnings (P/E) Ratio: The P/E ratio is calculated as the price to earning per share (EPS). It is calculated as:
P/E Ratio = Market Price / Earnings Per Share (EPS)
Price-to-sales (P/S) Ratio: The P/S ratio is the market capitalisation to its revenue of a company. It’s a metric used to show investors’ willingness to pay for each ₹1 of revenue.
It is calculated as:
P/S Ratio = Market Capitalization / Revenue
EV multiples:
- EV/Revenue:It is calculated as the company’s total Enterprise Value to Sales or Revenue. It is used to measure performance against competitors.
EV/Revenue = Enterprise Value/ Revenue or Sales
- EV/EBITDAR: It is calculated as the total Enterprise Value to Earnings before Interest, Tax, Depreciation & Amortization, and Rental Costs. It is usually used in the hospitality and transportation sectors.
EV/EBITDAR = Enterprise Value/ EBITDAR
- EV/EBITDA: It is calculated as Enterprise Value to Earnings before Interest, Tax, Depreciation, and Amortization. It is a metric for company valuation as well as comparing companies across different sectors.
EV/EBITDA = Enterprise Value/ EBITDA
- EV/Invested Capital: It is calculated as the total of Enterprise Value to Invested Capital. It is commonly used in capital-intensive sectors.
EV/Invested Capital = Enterprise Value/ Invested Capital
Growth Metrics: Revenue, Earnings, ROE, RoCE
| Metrics | Description | Formula |
| Revenue | Revenue is the total income of a business or a company from selling goods or services or both. | Revenue = No. of units sold or No. of customers x Selling Price or Average Price of service |
| Earnings | Earnings can be denoted as Net profit or profit after tax a company earns after deducting all the indirect expenses and taxes, from their net income or total revenue. | Earnings = Total Revenue – Indirect Expenses – Tax |
| ROE | Return on Equity (ROE) is a profitability ratio that represents returns or income generated from shareholders’ funds. | ROE = Net Income/ Shareholders’ Equity |
| RoCE | Return on Capital Employed (RoCE) is a financial ratio used to measure profitability and operational efficiency of a company from its capital. | RoCE = Operating Profit/Capital Employed |
Risk & Volatility Metric for sector analysis: Beta, Correlation, Dispersion
| Metrics | Description | How is it interpreted |
| Beta | Beta is a metric used to measure market price volatility of a stock, portfolio or sector. It represents risks, market fluctuation and uncertainty. | It is calculated using this formula: β = Cov(Rp, Rm) / σm²Where, Rp = Return, Rm = Market Return, Cov(Rp, Rm) = Covariance between portfolio return and market return, σm² = Market Return Variance |
| Correlation | Correlation is a metric that shows how two or more stocks or sectors move together. | It is commonly calculated using Pearson Product-Moment Correlation method.r = {n x Σ(XY) – (ΣX)(ΣY)} / √{(n * Σ(X^2) – (ΣX)^2) * (n * Σ(Y^2) – (ΣY)^2}Where, r=Correlation coefficient, n=Number of observations |
| Dispersion | Dispersion measures the variance between investment and its returns based on associated risks. | It can be calculated through Range, Variance and Standard Deviation. |
Sector Rotation & Timing Strategies
Sector rotation is a concept that involves identifying economic trends and aligning them to investments accordingly.
Timing strategies by aligning them with changing economic conditions:
- Expansion: Capital-intensive sectors like banking, real estate, etc. tend to outperform as demand for loans, construction and investments rise with economic growth.
- Peak: In this phase, technologies and sectors are strong; however, valuation goes high, which might require rebalancing of investment.
- Recession: Here, the healthcare, FMCG, and utilities sectors attract investors as the public would still spend on these essential commodities.
- Trough: In this stage, investors might accumulate undervalued stocks to position early with an anticipation of growth in the next cycle.
Macro & External Factors Affecting Sector Performance
Understanding the following factors that affect sector performance will help investors to analyse shifts in sectors, manage risks, and allocate capital effectively.
- Political Environment: Changes in government policies, tax rates , trade policies, and labor rules affect how sectors perform. A stable government supports growth, while fluctuations can increase risk.
- Economic Conditions: The economic factors, such as GDP growth, inflation, interest rates, employment, and disposable income, drive demand and profits across sectors. Strong economic growth supports capital-intensive sectors, and slow growth favours defensive sectors.
- Socio-Cultural Dynamics: The lifestyles of consumers, demographic changes, literacy rate, and cultural differences influence the demand and supply of goods and services. These help investors identify sectors with growth potential.
- Technological, Environmental & Legal Forces: Technological advancements, sustainability, and legal frameworks could create opportunities as well as challenges. Sectors adapting to innovation, environmental practices, and legal compliance could generate better returns.
Step-By-Step Process to Perform Sector Analysis
Sector analysis can be performed using different methods. Let’s continue this discussion using Porter’s Five Forces Model!
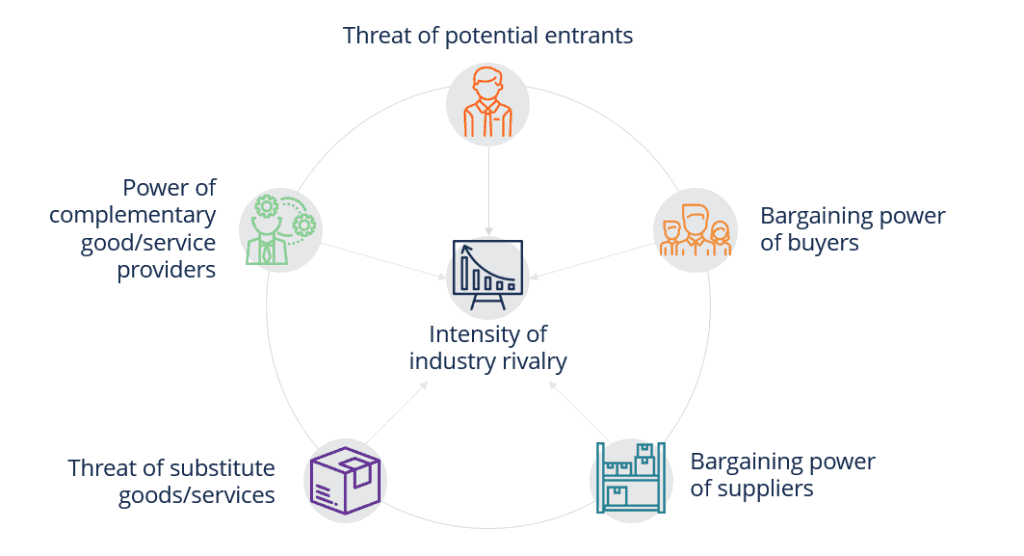
Porter’s 5 Forces, also known as the Competitive Forces Model, is a popular method developed for sector or industry analysis.
Competition: The competition in the sector is denoted by the number of participants and their market shares. The lack of product differentiation increases the level of competition. While high costs of exit, such as fixed assets, government regulation, labour unions, etc., increase the level of competition.
Threat of new entrants: The ease of market entry indicates the level of risk from new entrants. Easy entry often means an increase in competition, while restriction on entry allows existing companies to maintain competitive advantages.
Bargaining power of suppliers: It means that if the sector has a limited number of suppliers, the supplier will have more bargaining power, and vice versa. This affects new or small companies as it could influence cost structures, quality, and selling price of the product.
Bargaining power of buyers: Here, the customers are in a position to bargain for lower prices, better quality, and even additional services and discounts. It happens when a sector has more competitors, which leads to exceeding supply in comparison to demand. For example FMCG industry which comprises a huge number of competitors.
Threat of substitute goods/services: There is constant competition among sectors offering substitute products. Which means, firms in one sector could have competitors from other sectors. This impacts profitability because they are unable to charge excessive prices.
Case Studies: Comparing Sectors Over Time
Using Sector Analysis and Heatmaps: Investors use a 5-year sector heatmap across industries like commercial, hardware, fertiliser, consumer durables, media and others to spot trends, compare performance and reallocate funds, showing how sector analysis supports investment decisions.
This table shows the sector performance heatmap for 5 years.
| Commercial | +6052.32% |
| Hardware Technology | +2644.42% |
| Fertiliser | +1854.78% |
| Consumer Durables | +1818.06% |
| Media | +1478.47% |
| General Industrials | +1189.44% |
| Others | +702.27% |
Tracking quarterly sector shifts: A quarterly sector score changes across different industries, pointing to strong gains in hardware technology (+62.71%) and auto (+13.57%), using this analysis to compare performance and timely portfolio adjustments.
This table represents the quarterly sector performance heatmap.
| Hardware Technology | +62.71% |
| Automobile | +13.57% |
| Others | +12.17% |
| Diversified | +9.12% |
| Commercial | +6.50% |
| Retailing | +5.26% |
| FMCG | +4.66% |
Tools / Platforms and Data Sources for Sector Analysis
Here are some tools or platforms for Sector analysis Course:
- Stoxo: It is a stock market AI for Indian retail investors that offers sector indexes, filters, and performance charts, allowing investors to evaluate sector performance and investment opportunities.
Here’s an example of results shown by Stoxo for the FMCG sector analysis:
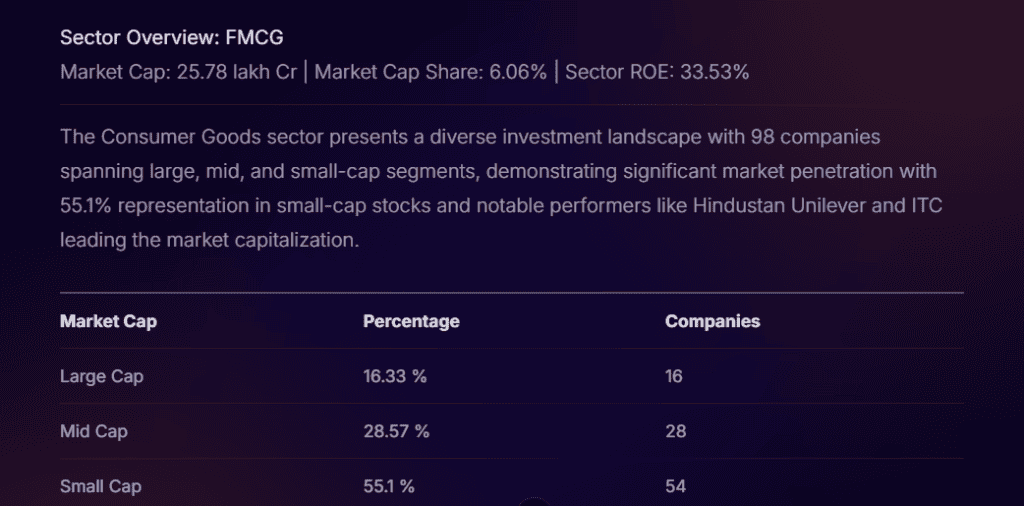
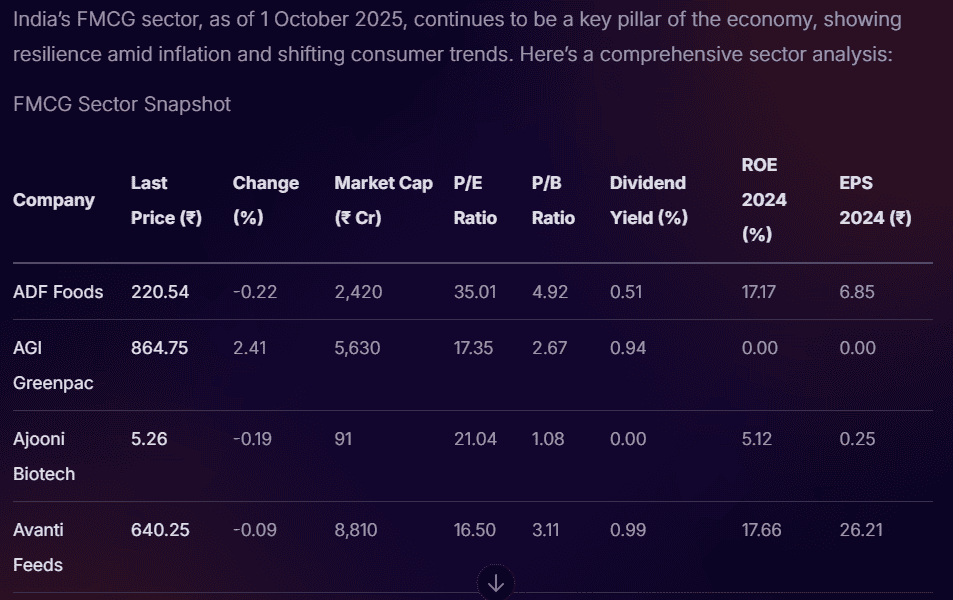
This results shows a comprehensive analysis of different companies in the FMCG sector in India, as of 1 October 2025.
- Trendlyne: It delivers sector performance scorecards and heatmaps, offers fundamental analysis and forecasting tools, while assisting investors in tracking opportunities and risks across sectors.
- TradingView: It offers advanced charting, global sector heatmaps, and technical analysis, which helps investors to monitor sector performance through visualisation and identify rotation opportunities.
- Koyfin: It provides dashboards, sector-wise analysis, and macroeconomic data, which supports investors to identify overachieving sectors and analyse valuation.
Data sources for sector analysis:
Stock Exchanges (NSE, BSE): The stock exchanges provide official sector-based indexes, leaders and losers, and historical charts.
Economic Institutions: Economic institutions such as the RBI, the IMF, World Bank, Ministry of Finance provide macroeconomic indicators that impact sectors.
Company Reports: This includes annual reports, quarterly earnings, and industry overviews from different companies.
Applying Sector Analysis to Your Portfolio
This is how an investor can apply sector analysis to their portfolio:
- Identify Growth Sectors: By spotting and allocating funds in sectors with strong income, demand, and government support, for example banking sector, investors might increase their portfolio returns.
- Balance Sectors: Investors could focus on sectors such as FMCG or healthcare to reduce risk and protect capital against market uncertainty.
- Focus on Sector Cycles: Investors can allocate their funds to different sectors in different cycles in the business cycle for smooth performance through economic fluctuations.
- Identify Sector Rotation: Investors can use tools and analyse data to shift their allocations based on macro conditions changes, to ensure the portfolio stays aligned with market movements.
Conclusion
Stock market sector analysis helps investors understand sector performance and identify growth opportunities and risks through diversification and rotation.
Investors can make informed decisions by using the right metrics and tools, as well as stock market AI, and align their portfolios with economic activities.
FAQs
Sector analysis in the stock market is the study of different sectors in an economy to find growth opportunities, assess risks, and understand where to invest effectively.
Capital-intensive sectors like banking, real estate, and autos do well during the expansion stage. During peak, technology and industrials perform strongly; however, valuation rises. In a recession, defensive sectors like FMCG and healthcare attract investors.
Investors use valuation ratios such as P/E, P/S, EV multiples, growth metrics such as revenue, earnings, ROE, RoCE, and risk measures, beta, correlation, and dispersion to compare sector performance.
Investors can know about rotation by monitoring economic indicators like GDP growth, inflation, interest rates, and corporate earnings, which help investors identify when sectors may rotate.
Political environment, economic conditions, socio-cultural dynamics, technological environment, and legal framework (PEST) can influence sector performance.
In the case of long-term, focus on growth and stable sectors with strong fundamentals.
In the case of short-term, follow rotation strategies to capture sector movements during different business cycles.
Sector analysis tools like Stoxo, Trendlyne, TradingView, and Koyfin provide heatmaps, sector performance charts, valuation and forecasting features, which help investors to compare sectors and identify opportunities.
Concentrating in a particular sector, avoiding macroeconomic indicators, or wrong estimation in rotation could impact returns.

Leave a Comment