
Breakout stocks can offer strong moves, but spotting them before the price jumps is not always easy. Understanding how to find breakout stocks helps you catch these moves early as the price pushes past an important resistance level. A study of 100 breakout setups found that about 58% worked well when supported by volume and basic indicators, highlighting the importance of proper confirmation. This blog breaks down simple, practical ways to identify and trade breakout stocks smartly.
What is a Breakout Stock?
A breakout stock is a company’s share that has moved beyond a set trading range. For a period, the stock’s price may have stayed between a lower level (support) and an upper level (resistance). A breakout takes place when market price moves decisively over resistance or slides beneath support. This movement is often accompanied by a higher-than-usual trading volume. Such a move signals that the market’s view of the stock may be changing, potentially starting a new price trend in the direction of the break.
Why Breakout Stocks Matter in Trading & Investing
Understanding breakouts can be important because they may signal significant shifts in a stock’s price movement. They indicate that the previous equilibrium between buyers and sellers has altered. Identifying a stock as it breaks out of its range can provide information about potential new trends. This matters to market participants for several reasons, which include:
- Signaling new trends: A breakout can be one of the first signs that a new upward or downward price trend is beginning, moving away from a period of sideways movement.
- Indicating shift in sentiment: The action of breaking past a key price level, especially with high volume, shows a strong change in market sentiment. A break above resistance suggests buyers have become more assertive, while a break below support suggests sellers are in control.
- Identifying opportunities: For traders, a confirmed breakout can represent a potential entry point to follow the new trend. For investors, a breakout on a long-term chart might confirm a change in the stock’s long-term direction.
- Risk management points: The breakout level (the old resistance or support) often becomes a new reference point. For example, old resistance may become new support, which can be used for setting risk management levels.
Key Indicators & Criteria for Breakouts
To determine if a breakout is genuine, analysts look for several signals. This collection of signals forms the basic breakout stock criteria. The most common indicators used are as follows:
- Support and Resistance Levels
Support is the point where past price declines have paused and reversed, working much like a lower boundary. Resistance is the opposite; it’s a price level that a stock has had trouble rising above, acting like a price ceiling. These support and resistance zones serve as the basic building blocks of breakout evaluation. A breakout is identified once the price cleanly crosses a resistance line or falls through support. Identifying these historical price barriers on a chart is the first step.
- Volume Surge & Confirmation
Volume breakout refers to the number of shares being traded. A key sign of a strong, genuine breakout is a large increase, or surge, in volume. When the price breaks through a resistance level, and at the same time, the trading volume is much higher than average, it gives the move more credibility. This high volume suggests strong participation and conviction from buyers, confirming that the new price level is supported by significant interest. A move that breaks out but has low volume generally has a higher chance of failing.
- Technical Patterns (Triangles, Flags, Channel Breaks)
Before a breakout, a stock’s price often moves in a tightening range known as a consolidation pattern. Chart analysis looks for these setups. The primary patterns include:
- Triangles: The price moves between converging trendlines.
- Flags: A short, rectangular pattern that slopes against the previous sharp move.
- Channels: The price bounces between two parallel trendlines (either horizontal or sloped).
A break out of one of these defined patterns signals the end of the consolidation and the possible start of a new move.
- Momentum Indicators (RSI, Moving Averages)
Momentum indicators are tools that can help measure the strength or speed of a stock’s price movement.
- Relative strength index (RSI): It evaluates the rate and intensity of price shifts on a 0–100 range. This measures the speed and change of price movements, typically on a scale of 0 to 100. A rising RSI along with a price breakout can help confirm bullish strength.
- Moving averages: Moving average lines filter noise from prices to display their general movement. A stock’s price moving above a key moving average (like the 50-day or 200-day average) can be used to confirm that a new uptrend is gaining strength.
Step-by-Step Roadmap: How to Find Breakout Stocks
Finding achievable breakouts involves a proper process. The general method for how to identify breakout stocks can be broken down into the following steps:
Step 1: Scan / Filter for Candidates
The first step is to narrow down the list of thousands of stocks to a manageable number of potential candidates. Many trading platforms offer tools called stock screeners or filters. Users may screen for shares approaching their 52-week high or low, often used as resistance or support levels. Scans can also be used to find stocks showing unusually high trading volume or stocks that have been in a narrow price range for a long time.
Step 2: Visual Chart Analysis & Pattern Setup
Once you have a list of candidates from your scan, the next step is to look at their price charts individually. This approach helps you pinpoint crucial support and resistance areas with better accuracy. You would look for the clear price “ceilings” or “floors” mentioned earlier. You would also look for any of the consolidation patterns, such as triangles, rectangles, or flags, that might be forming just before a potential break.
Step 3: Confirm Breakout with Volume & Time-frame
This step is about patience. It is not enough to see a stock near its breakout level; you must wait for it to actually break through. Many traders wait for the price to close above resistance or below support, rather than just moving past it during the day. A breakout is best validated when volume jumps sharply at the same moment. A breakout without solid volume often looks unpersuasive. It can also be helpful to check multiple time-frames (e.g., a daily chart and a weekly chart) to see if they both show the same breakout.
Step 4: Entry, Stop-Loss & Trade Management
After a breakout is confirmed, some traders may decide to enter a position. A critical part of this step is risk management. This often involves placing a stop-loss order, which is a preset order to exit the position at a specific price if the trade moves against you. For a breakout above resistance, a stop-loss might be placed just below the resistance level that was broken. It helps keep the capital intact when a breakout reverses and slips back to previous range.
How to Use an AI Tool (e.g., Stoxo AI) to Find Breakout Stocks )
AI-powered tools have simplified the process of identifying market opportunities, allowing users to find stocks without needing complex manual filters. By using plain simple commands, tools like Stoxo AI can instantly scan the market to match specific criteria.
To pinpoint details of the potential breakout stocks, when given the prompt, “Find me 5 breakout stocks today above their key resistance levels with high volume. Focus on companies with a market cap over ₹5,000 Cr and positive momentum”
When given this prompt, Stoxo assessed real-time market data and returned five specific results as shown in the image below.
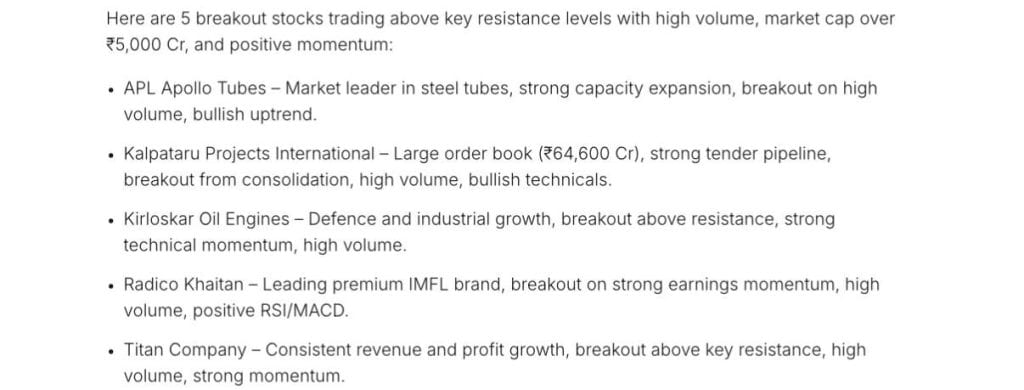
It summarised that all five companies are currently breaking past key resistance levels with high trading volume, supported by strong fundamental factors like robust order books and earnings momentum.
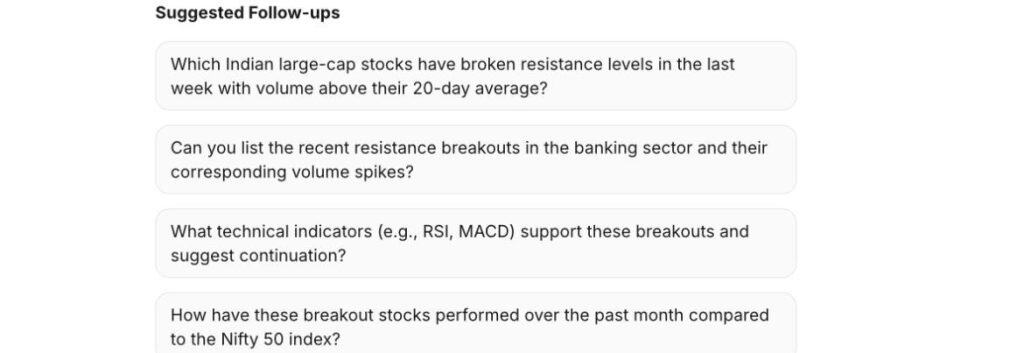
It not only created a list but also suggested thoughtful follow-up queries to refine insights.
Case Study: Breakout Stocks in Indian Market
Based on market data as of November 18, 2025, the top five breakout stocks in Indian Market are as follows:
| Stock name | Current price (₹) | P/E ratio | Market cap (₹ Cr.) |
| BSE Ltd | 2,847.50 | 64.41 | 115,811 |
| R M Drip & Sprinklers | 78.80 | 62.61 | 1,968 |
| Multi Commodity Exchange (MCX) | 9,721.95 | 71.26 | 49,580 |
| Gokul Agro Resources | 213.70 | 21.53 | 6,306 |
| HBL Engineering | 1031.50 | 43.20 | 28,592 |
Common Mistakes & How to Avoid False Breakouts
A “false breakout,” or “fake-out,” is the most common pitfall. This happens when a stock’s price moves above the resistance level but quickly reverses and falls back into its previous range. Steering clear of problems starts with knowing common mistakes like:
Analysts watch for these common mistakes, as follows:
- Ignoring volume: A price breaking out on very low volume is a common red flag. This often signals a lack of conviction, and the price can easily fall back down.
- Acting too early: An analyst might enter a trade before the price has actually closed above resistance or below support. The price might touch the level but fail to break through.
- Chasing after the price: After a breakout is confirmed, the price might move very quickly. Chasing means buying far above the breakout level, which can lead to a poor entry point if the stock pulls back.
- Failing to use stop losses: Not setting a stop-loss order means there is no defined plan for what to do if the trade fails. A standard way to control losses is setting a stop-loss below the level where the breakout occurred.
Conclusion
Knowing how to find breakout stocks helps you spot new trends, but consistency is what matters most. Since markets change often, having a calm approach is key. Concentrate on sensible decision-making, not on pursuing every quick price rise. With steady effort and good risk control, you can build a sustainable approach to trading without taking unnecessary chances.
FAQ‘s
Beta measures a stock’s volatility relative to the overall market. It’s calculated by comparing the covariance of the stock’s returns to the variance of the market returns over a period, typically using regression analysis to quantify its sensitivity.
Breakout stocks are identified by price moving above a historical resistance level on higher-than-average volume. Volume surge confirms buyer interest, validating the breakout. Chart patterns near resistance along with volume spikes signal potential strong upward price trends.
Common breakout patterns include price moving out of consolidation zones such as rectangles, triangles, and flags. Breakouts are signaled when price closes above resistance or below support levels, often accompanied by increased volume and momentum indicators confirming the move.
Stock screeners allow filtering by criteria like price near 52-week highs, volume surges, volatility, and market cap. Filters for technical indicators, trend strength, and price patterns help locate confirmed or potential breakout stocks efficiently for faster decision making.
Avoid false breakouts by waiting for price confirmation such as closing above resistance, checking for volume increase, using multiple time-frame analysis, employing stop-loss orders around breakout levels, and considering broader market and sector trends to confirm genuine momentum.

Leave a Comment