If you are a day trader, you may want to learn about the RSI, a technical indicator that can help you analyse the market and make trading decisions. RSI’s full form is denoted as the relative strength index that measures the speed and direction of price movements and shows you when the market is overbought or oversold.
You can also use the RSI to find divergences, trendlines, and trading signals. In this article, we will tell you what the RSI is, how to calculate it, and how to use it in your day trading strategy. Let’s begin!
What is Relative Strength Index?
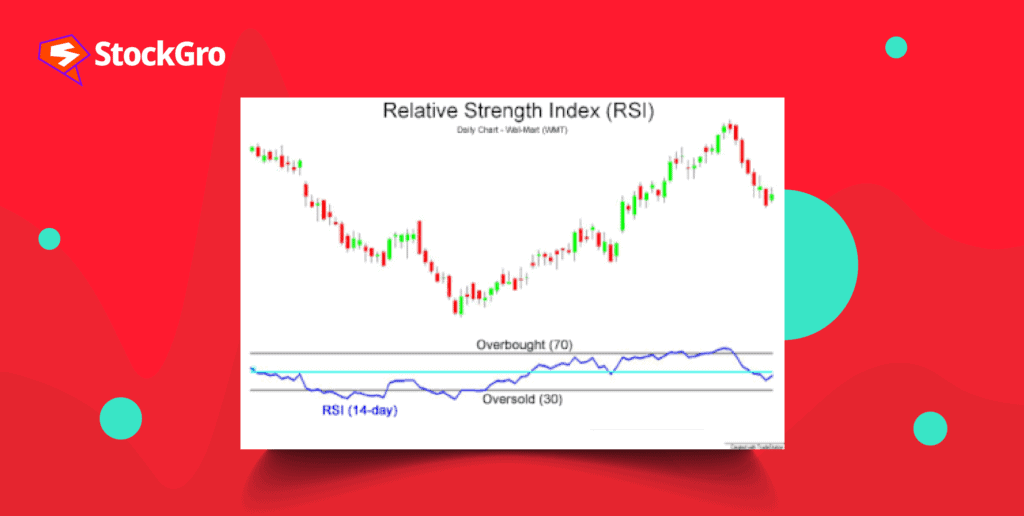
J. Welles Wilder created the relative strength index (RSI), a momentum oscillator that gauges the rate and direction of price changes. It generates an index between 0 and 100 by calculating average gains and losses in relation to prices from prior periods.
The RSI in the share market oscillates between 0 and 100. Consequently, a stock price decline throughout each of the 14 trading days is indicated by an RSI of 0. Comparably, an RSI of 100 indicates that the stock price has increased throughout each of the last 14 trading days. Technical analysis defines an overbought region as having an RSI over 70 and an oversold area as having an RSI below 30.
Additionally, RSI may be utilised to determine the overall trend. For instance, you would wish to raise the overbought threshold of a security to 80 if it keeps hitting the 70 mark.
How does Relative Strength Index (RSI) work?
Overbought is defined as the RSI being over 70 and below 30, and vice versa. These standard levels can also be adjusted as needed to better fit security requirements. For example, if a security is moving closer to the overbought level of 70 all the time, you could increase this barrier to 80.
Traders can gain insight into the potential performance of an asset by comparing the outcome of this comparison to price movement. Master the return on assets ratio with ease! Our detailed breakdown of the return on total asset ratio formula explains what is return on assets.
To use the RSI in your trading, you need to look at the RSI level and the RSI direction. The RSI level tells you the strength of the price movement. To identify possible potential trades, you may use the RSI to check for crossover indications, trendlines, and divergences.
A bullish divergence is when the price falls to a new low, but the RSI rises to a higher low, showing that the sellers are losing strength. A bearish divergence is when the price rises to a new high, but the RSI falls to a lower high, showing that the buyers are losing momentum. These are signs that the price trend may reverse soon.
RSI indicator formula
The Relative Strength Index (RSI) is a momentum oscillator that measures the speed and change of price movements. It tells you whether an asset is potentially overbought or oversold.
The core idea is to compare the magnitude of recent gains to recent losses over a set number of periods (commonly 14). The RSI value always stays between 0 and 100.
Formula: RSI = 100 − (100 / (1 + RS))
Where:
- RS (Relative Strength) = Average Gain ÷ Average Loss
- Average Gain = Sum of all gains over the period ÷ number of periods
- Average Loss = Sum of all losses over the period ÷ number of periods
This gives traders a quick view of the market’s momentum.
How To Calculate Relative Strength Index
(RSI) ?
There are two parts to the relative strength index formula:
- Average gain % = the total gains over the previous 14 periods / 14
- Average loss % = the total losses over the previous 14 periods / 14
With the relative strength index formula mentioned below, you can easily calculate RSI.
To determine the relative strength of an asset, the method employs a 14-period look back, which takes into account the previous 14 candles on a chart.
When a trader uses a variable’ Y,’ usually 14, with RSI, the indicator will be able to grade the price fluctuations between candles over the past ‘Y’ periods. In order to demonstrate the “strength” of the market, RSI will track price changes as they occur in relation to past price swings.
What is RSI Divergence
RSI divergence happens when price action and RSI move in opposite directions and this often signals a possible reversal.
There are two types:
- Price makes a lower low
- RSI makes a higher low
This suggests selling pressure is weakening — buyers might step in soon.
- Price makes a higher high
- RSI makes a lower high
This hints momentum is slowing — sellers might take over.
Think of divergence as an early warning — not a guarantee — that trend strength is changing.
What is RSI Convergence
RSI convergence is when price and RSI are aligned and moving in the same direction.
This usually supports the current trend and confirms strength:
- Price makes higher highs & RSI also makes higher highs → Uptrend is strong
- Price makes lower lows & RSI also makes lower lows → Downtrend is strong
In simple terms:
Convergence = Trend confirmation.
No hidden signals here, just reinforcement that the trend is intact.
RSI vs Other indicator
RSI is popular, but how does it compare with others? Let’s see:
| Indicator | What It Measures | Key Difference from RSI |
| MACD | Trend direction and momentum | Uses moving averages and crossover signals; RSI focuses on identifying overbought and oversold levels. |
| Stochastic Oscillator | Price position relative to its recent range | Reacts faster than RSI, making it useful for short-term signals, but it can be noisier and less reliable in choppy markets. |
| Moving Averages | Overall trend direction | Smooths price action to show trend but does not indicate overbought or oversold conditions like RSI does. |
| Bollinger Bands | Volatility and price dispersion | Shows how far price moves from its average; RSI focuses on momentum rather than volatility. |
| ADX | Strength of the trend | ADX measures how strong a trend is but does not indicate if a stock is overbought or oversold, which is RSI’s key role. |
| ATR (Average True Range) | Market volatility | Measures how much price moves, not the direction or momentum; RSI focuses on price strength and momentum. |
| EMA (Exponential Moving Average) | Trend direction with recent price weightage | Reacts faster to recent price changes than simple moving averages; unlike RSI, it does not signal overbought or oversold levels. |
In practice, many traders combine RSI with trend-strength or volatility tools to reduce false signals.
How do you trade with RSI in day trading?
When considering how to use the RSI indicator for day trading, keep in mind that day trading entails purchasing or selling underlying assets on the same trading day. Learn how to calculate stop-loss in intraday trading. Explore what is intraday trading, stop-loss in trading and ways to fix stop-loss levels.
Effective day trading is about quality (picking the best high-probability short-term deals) rather than quantity (taking numerous trades in a single day).
Strategies can assist traders in identifying and exploiting the greatest intraday chances in both range and trending markets.
When using RSI in trading, traders must also be aware of overbought and oversold signs. While the default RSI settings is 14 periods, day traders can alter it to 6 to 9 periods to get more overbought and oversold signals. These levels should ideally correlate to levels of support and resistance.
If RSI is low:
When a market is overbought, the RSI indicator signals it. This happens when the RSI falls below 70.
This indication can be used by traders in two ways:
- They may sell if they are currently long (expecting prices to climb).
- They may open a short position if they are not already in the market, banking on prices falling.
If RSI is high:
When the RSI crosses back over the 30 mark, it is considered an oversold signal.
Traders may use these indications in one of two ways.
- A trader with no open positions may consider utiliszing the oversold signal as a signal to begin a new ‘long’ trade, so entering the market with a purchase because the price is expected to climb in the short term. If you want to know about effective exit strategies for day trading to secure gains and limit losses, learn tips for timely exits and risk management.
- If a trader has already sold short in the market, the oversold signal may be used to lock in profit (if the price has declined) and terminate the deal with a purchase.
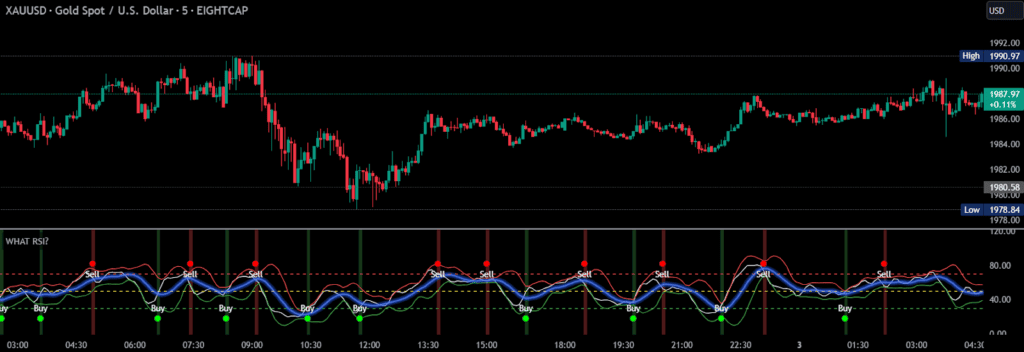
RSI Indicator: Buy and Sell Signals
The RSI indicator is an amazing tool for identifying potential buy and sell signals in day trading. When using the RSI, traders focus on two key levels, 70 and 30 to understand market conditions.
An RSI reading above 70 shows that an asset is overbought, which could be a good time to sell or take profits since the price might be about to drop.
On the flip side, if the relative strength index falls below 30, it tells us about oversold conditions, suggesting a potential buying opportunity as prices may be ready to bounce back.
Day traders often adjust the RSI period settings to match their trading strategies. While the default setting is 14 periods, reducing it to a shorter period, like 6 to 9, can provide more frequent signals, making it ideal for capturing shorter-term price movements.
Additionally, traders can look for bullish or bearish divergences between the RSI and price action. For example, if the RSI rises while the price is still falling, it indicates that momentum may be shifting, hinting at a potential trend reversal.
Just remember, these buy and sell signals from the RSI are not 100% accurate and you should confirm them with other technical indicators or support and resistance levels to avoid false signals. Using RSI in combination with trendlines or moving averages can help you make more informed trading decisions.
Importance of RSI Indicator
RSI has become one of the most widely used indicators:
Momentum insight: It shows whether bulls or bears are gaining speed.
Helps identify potential reversals: Divergence can give early warning before price changes direction.
Clear visual signals: Overbought/oversold levels (70/30) are easy to interpret.
Works in multiple timeframes: Day traders and long-term investors both use it.
Complements other tools: Pairing RSI with volume, trendlines, or moving averages gives stronger setups.
Limitations of RSI Indicator
False signals: In strong trends, RSI can stay overbought/oversold for a long time — leading to false entries.
Lagging nature: Because it’s based on past price action, RSI does not predict the future — only suggests probability.
Less effective in trending markets: RSI works best in sideways markets; in strong uptrends, an overbought RSI doesn’t always mean sell.
Needs confirmation: Signals are stronger when combined with price action or other indicators — not standalone.
Conclusion
When assessing the strength of price moves for different financial products, the RSI is a widely utilised technical analysis tool. When used with appropriate indicators, RSI creates a useful system that may be adjusted by adjusting the instrument settings.
The potential to generate misleading signals and the inability to forecast the size of market reversals are two of RSI’s drawbacks. For traders attempting to master the intricacies of the stock market, RSI is still a helpful indicator despite these shortcomings.
FAQ’s
RSI stands for Relative Strength Index. It is a popular momentum indicator used in stock market analysis to understand how strong or weak a stock’s recent price movement has been.
A high RSI value indicates that a stock may be overbought, meaning prices have risen too quickly in a short period. Typically, an RSI above 70 suggests overbought conditions, while an RSI below 30 indicates oversold conditions.
RSI is read on a scale of 0 to 100. When RSI moves above 70, it signals strong buying pressure and a possible slowdown or pullback. When it falls below 30, it suggests heavy selling pressure and a potential bounce. Values between 30 and 70 usually indicate a neutral or stable trend.
RSI measures the speed and strength of recent price changes. It helps traders understand whether a stock is gaining momentum too fast or losing momentum, making it useful for spotting possible reversals or pauses in price movement.
There is no single “perfect” RSI value. In a healthy uptrend, RSI often stays between 40 and 70, while in a downtrend, it may remain between 30 and 60. The key is to compare RSI levels with the overall trend rather than relying on a fixed number.
There is no universally correct RSI level. What matters is how RSI behaves relative to past levels, trend direction, and price action. Traders focus more on RSI ranges, divergences, and changes in momentum rather than one exact value.
RSI is calculated by comparing the average gains and average losses over a specific period, most commonly 14 days. The result is converted into a value between 0 and 100. While the calculation is done automatically on trading platforms, understanding that it reflects the balance between recent gains and losses helps in using RSI more effectively.