Have you heard of a trending market? It is where the prices of stocks are moving in the same direction for a considerable amount of time. If the stock prices are increasing, the market is said to be in an uptrend. If the stock prices are decreasing, it is a downtrend market.
Analysing the trend is essential for traders as moving in the opposite direction may lead to losses. Hence, traders use various technical indicators to analyse trends and plan their strategies in the same direction.
Also Read: Essential guide to candlestick patterns for beginners
Aroon indicator is one such tools used in technical analysis of stocks. Introduced by Tushar Chande in 1995, Aroon means the early morning light in Sanskrit. Like the morning light indicates a new day, this indicator tries to suggest the beginning of a new trend, hence the name.
What is the aroon indicator?
Aroon indicator is a technical tool used to analyse the price trends of stocks. It helps in understanding the strength of the ongoing trend and identifying potential new trends.
In a normal scenario, if a stock is currently under a strong uptrend, the prices are expected to increase further. If the stock’s downtrend is strong, the prices may reduce further. The aroon indicator suggests whether the trend is strong enough to follow this pattern.
How Does the Aroon Indicator Work
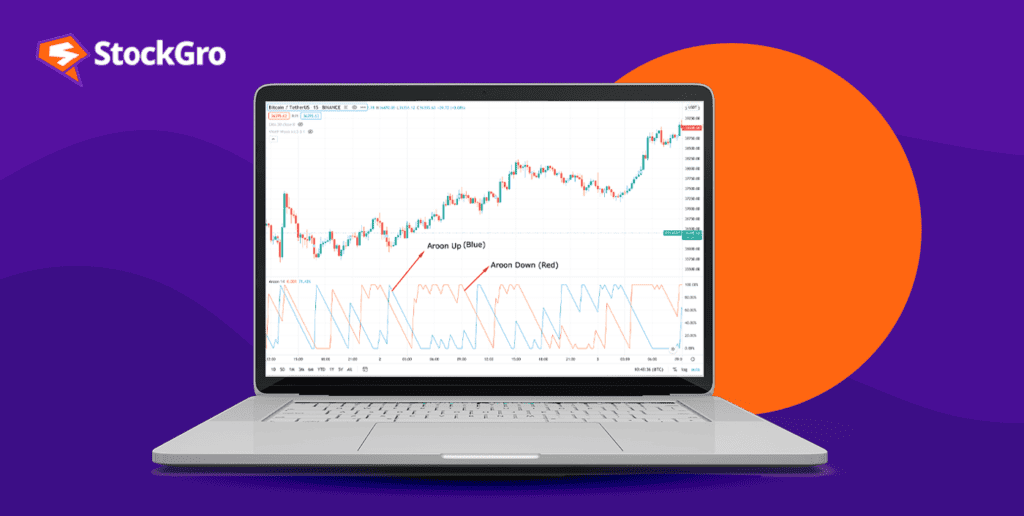
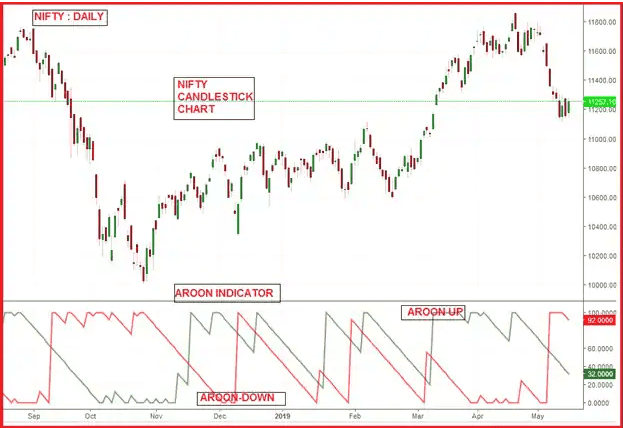
The aroon indicator uses two separate lines, one below another, to analyse the strengths of up and downtrend. The uptrend line is commonly called aroon up, and the downtrend line is called the aroon down.
The first line, i.e., the line on the top indicates the dominant trend. So, if the aroon up line is above the aroon down, it suggests an up-trending market and vice versa.
The Aroon indicators can help determine the market trend. When the Aroon Up is higher than the Aroon Down, it indicates a bullish market. Conversely, when the Aroon Down is higher than the Aroon Up, it indicates a bearish market. If the two Aroon lines intersect, it suggests a possible change in the market trend.
The aroon indicator is different from other indicators since it considers the time between two highs or two lows to determine the strength of the trend. While most indicators use price to analyse trend strengths, aroon uses the time duration.

Source: Moneycontrol
Aroon indicator considers 25 periods for trend analysis. A period is the time considered to analyse a stock. So, aroon considers 25 such periods to determine how strong a trend is. The aroon value fluctuates between 0 and 100.
- If the aroon up measures above 50, the stock reached a new high in the last 12.5 days.
Also Read: Do all technical analysis tools work equally well?
Consider an example where the last high was 3 days ago:
= [(25-3)/25]*100
= 88
Since the aroon up is above 50, it suggests that the stock reached its latest high in the last 12.5 days.
- If the aroon up values below 50, the stock has not reached a new high in the last 12.5 days.
Consider an example where the last high was 14 days ago:
= [(25-12)/25]*100
=44
Since the aroon up is below 50, it suggests that the stock did not reach its latest high in the last 12.5 days.
- If the aroon down values above 50, the stock has reached a new low in the last 12.5 days.
Consider an example where the last low was 6 days ago:
= [(25-6)/25]*100
=76
Since the aroon down value is more than 50, it suggests that the stock reached its new low in the last 12.5 days.
- If the aroon down values below 50, the stock has not reached a new low in the last 12.5 days.
Consider an example where the last low was 20 days ago:
= [(25-20)/25]*100
=20
Since the aroon down value is less than 50, it suggests that the stock did not reach its new low in the last 12.5 days.
If the aroon up is close to 100, the stock has reached a new high recently and vice versa. When both aroon up and down values are below 50, it suggests a non-trending market.
During a crossover, if the aroon up crosses above the aroon down, it suggests the rise of a bullish trend and is a signal to buy stocks.
If the aroon down moves on the aroon up, it suggests the start of a bearish trend and can be used as an indication to sell.
Aroon Indicator Formula
Formula:
Aroon up = [(25 – Number of periods since 25 high)/25)] * 100
Aroon down = [(25 – Number of periods since 25 low)/25)] * 100
- Since aroon lines are for 25 periods, check the high and low prices of stocks for the last 25 periods.
- Check the number of periods since the stock price reached its last high or low.
- Calculate the values using the above formula and plot them on the graph to create aroon up and down lines.
If you decide to use the aroon indicator for a different timeline, replace 25 with the number of periods you are calculating for.
Arron Indicator Example
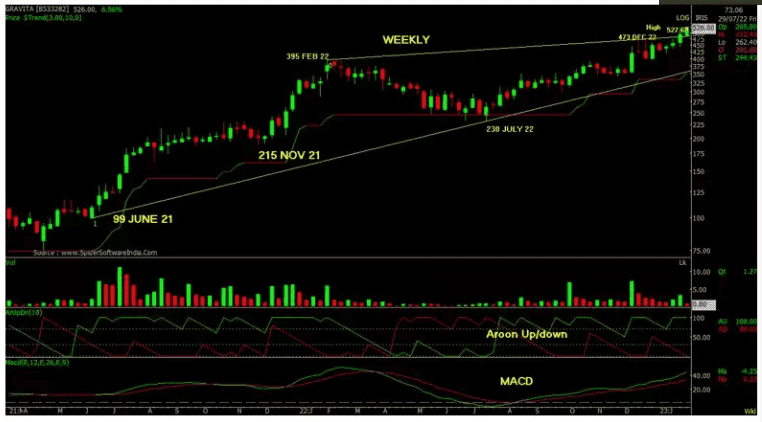
Below is an example of the stock prices of Gravita India in 2022. The aroon chart shows the aroon up (green line) and the aroon down (red line). It can be noticed that the aroon up is above for most of the periods, indicating a possible uptrend in the prices.

Source: The Economic Times
Benefits and limitations
The aroon indicator is simple when compared to other technical indicators. It is also flexible and effective in showing the price trends of a stock.
However, this tool mainly focuses on the time between highs and lows and does not help suggest the actual price differences. Also, the tool does not give the benefit of catching early trends as it waits for the trend to begin and then shows strength after a considerable amount of time.
Aroon oscillator
The Aroon oscillator is another component of the aroon indicator. It shows the dominant trend for a specific period.
Aroon oscillator = Aroon up – Aroon down.
If the aroon oscillator is positive (more than 0), the market is trending upward.
If the aroon oscillator is negative (less than 0), the market is down trending.
The aroon oscillator combines both up and down lines to provide a summary of the market situation.
Aroon Indicator vs RSI
When it comes to technical analysis, choosing the right indicator can make all the difference in your trading strategy. Two popular tools that traders often rely on are the Aroon Indicator and the Relative Strength Index (RSI). Let’s break down their features to see how they stack up against each other:
| Feature | Aroon Indicator | Relative Strength Index (RSI) |
| Purpose | Measures the time since the highest and lowest price over a set period. | Measures the speed and change of price movements. |
| Calculation Method | Compare the number of periods since the highest and lowest price. | Calculated using average gains and losses over a specified period. |
| Typical Range | Values range from 0 to 100, with levels above 70 indicating strong uptrends and below 30 indicating downtrends. | Ranges from 0 to 100, with levels above 70 indicating overbought conditions and below 30 indicating oversold conditions. |
| Timeframe | Flexible; can be used for various timeframes (daily, weekly, etc.). | Commonly used with 14-day periods but can be adjusted. |
| Interpretation | Focuses on trend strength and the potential for trend reversals. | Focuses on momentum and potential overbought or oversold conditions. |
| Visual Representation | Displays two lines (Aroon Up and Aroon Down) on a chart. | Plots a single line oscillating between 0 and 100. |
The Aroon Indicator excels in identifying the strength and direction of trends, making it a valuable tool for traders who prioritize trend-following strategies. On the other hand, the RSI shines in highlighting potential reversal points by measuring market momentum.
Ultimately, the choice between the Aroon Indicator and RSI depends on your trading style and goals. Many traders find that using both in conjunction can provide a more comprehensive view of market dynamics, allowing for more informed decision-making.
Bottomline
Given the simplicity of this indicator, it is a suitable tool for beginners who want to venture into the technical analysis of stocks in the market. But, every technical indicator comes with its own set of pros and cons.
Similarly, the aroon indicator has the limitation of delaying the indication of trend strength and not showing price differences. Hence, it is best used with other technical indicators like the Average Directional Index (ADX) for accurate results.
Further reading: What is ADX indicator? Make informed trades by tracking market trends.

