
Identifying undervalued stocks isn’t just about low prices—it’s about avoiding hidden risks like liabilities, falling sales, or weak management. Strong companies are often overlooked simply because they’re outside market hype. The real challenge is spotting genuine value versus red flags. With the right metrics and strategy, you can find true undervalued stocks before the market does. Let’s begin!
First, What are Undervalued Stocks? Under value stocks are shares of those companies that sell for less than what they are supposedly worth. This happens when the market price of a stock is lower than its intrinsic value, which could be determined based on economic performances, assets, or prospects for future growth.
Such situations may come about because of market overreaction, temporary problems, or pure lack of investor attention. These stocks are under the radar of most investors simply because they may present lucrative potential if eventually brought back to align with actual fundamentals.
How to Find Undervalued Stocks
To find undervalued stocks, analyse the key metrics like Price-to-Earnings (P/E) and Price-to-Book (P/B) ratios, earning growth potential for companies. It requires examining financial data, comparing against industry standards, and spotting whether the market has overlooked a company’s strengths.
To support this process, advanced tools now simplify research. One such platform is Stoxo, launched by StockGro. Stoxo is an AI-powered stock market research engine designed for retail investors, combining algorithm-driven analysis with human-like reasoning.
Key Metrics to Spot Undervalued Stocks
To learn how to find undervalued stocks, several financial metrics and ratios need to be considered, which include the following:
- Price‐to-Earnings (P/E) – Trailing & Forward
The PE ratio ratio compares a firm’s stock price with its earnings per unit of share. Trailing P/E relies on past earnings, whereas forward P/E projects upcoming earnings. A lower P/E may indicate that the stock is priced modestly relative to profits, though it should be compared with industry averages and historical trends. Consistency over time can reveal whether the stock is truly undervalued.
- Price-to-Book (P/B)
The price to book ratio evaluates the share price in relation to the firm’s book value per unit. A P/B ratio under 1 may imply the stock trades below its actual net asset worth. It is important to evaluate the quality of assets and industry norms before drawing conclusions, as some sectors naturally have higher or lower P/B ratios.
- PEG Ratio (P/E to Growth)
The PEG ratio adjusts the P/E ratio by expected earnings growth, offering a measure of valuation relative to growth. A smaller PEG could imply that a stock is priced lower compared to its growth capacity. This ratio separates low-priced stocks that are truly undervalued from those with weak or stagnant performance.
- EV/EBITDA and EV/Revenue Ratios
Enterprise Value (EV) ratios such as EV/EBITDA and EV/Revenue include a company’s debt and cash in valuation. These ratios provide a broader perspective on valuation and can highlight companies trading at lower multiples than industry peers. They are particularly useful for comparing businesses with different capital structures.
- Dividend Yield & Earnings Yield
Dividend yield measures the annual dividend relative to share price, while earnings yield, the inverse of P/E, shows earnings relative to price. Higher yields may suggest the stock is priced conservatively. Both metrics should be assessed alongside payout sustainability and sector norms to understand their true significance.
- Debt Levels
A company’s debt levels indicate financial stability and risk. High debt can limit flexibility, while manageable debt suggests sound operations. Comparing debt ratios with industry standards helps determine whether low stock prices reflect undervaluation or financial concerns that could affect long-term performance
- Return on Equity
ROE shows how efficiently a firm produces profits using shareholder funds. A higher ROE may indicate strong management and efficient use of resources. Consistently high ROE can signal that the company is creating value for shareholders, even if the stock price appears low compared to peers.
- Free Cash Flow & ROIC
Free cash flow shows the cash a company generates after covering capital expenditures, while Return on Invested Capital (ROIC) reflects efficiency in using capital to generate returns. Strong free cash flow and high ROIC indicate that a company is financially healthy, which may not yet be fully recognized in its stock price.
Calculating Intrinsic Value
Intrinsic value is the assessed “true worth” of a stock, separate from its live market rate. Calculating it requires blending both numerical data and qualitative judgments. Commonly applied methods include:
- Discounted cash flow (DCF): Forecasts expected cash flows and discounts them to today’s value.
- Earnings-based models: Uses expected earnings growth and required return to measure fair value.
- Asset-based valuation: Considers net assets, often applied to companies with significant tangible holdings.
- Qualitative review: Factors such as leadership quality, brand strength, and industry advantage are considered.
Since no single formula is perfect, intrinsic value is usually calculated with multiple models and compared against market price for a balanced view.
Using Screeners & Tools for Identifying Undervalued Stocks
Digital stock screeners are not just about filtering low P/E or P/B ratios, they also help in spotting undervalued stocks by combining multiple metrics to uncover hidden opportunities. Advanced tools can rank companies based on factors like earnings growth, free cash flow consistency, dividend sustainability, and debt levels. This multi-dimensional approach ensures that cheap-looking stocks are evaluated in a holistic way.
Stock market AI platforms like Stoxo improve this process by providing live data, historical trend analysis, and sector comparisons in one place. Users can filter stocks based on undervalued stock metrics, compare peers across industries, and visualise which stocks are trading below their intrinsic value. This structured approach simplifies the process of stock valuation and reduces the risk of missing overlooked opportunities in the market.
Sector & Market Adjustments
Sector and market adjustments significantly influence the valuation of undervalued stocks, creating both opportunities and risks. Here’s a brief on how these elements influence markets:
- Market adjustments
Market-wide shifts can affect all stocks, including those considered undervalued. A broad market downturn, for example, can push the price of an undervalued stock even lower. Conversely, a bull market can lift all stocks.
- Interest rates: When RBI increases rates, corporate borrowing costs climb. This can hurt their profitability and, in turn, lower their stock prices.
- Economic growth: A strong economy can boost the earnings of most companies, increasing their intrinsic value. A recession can have the opposite effect.
- Investor sentiment: Market sentiment, driven by news, and economic data, can cause stock prices to deviate from their intrinsic values. The market crash triggered by COVID-19 in March 2020 stands as a clear case. Panic and doubt took over the markets, sparking heavy selling across industries. Even fundamentally sound companies with strong balance sheets saw their stock prices plummet to multi-year lows. This created a great opportunity for long-term investors to buy undervalued stocks at bargain prices.
- Sector adjustments
Sector-specific factors can also have a significant impact on undervalued stocks. A firm’s stock may be undervalued if its sector falls out of investor preference.
- Industry trends: Technological advancements, changes in consumer preferences, and new regulations can all affect the prospects of a particular sector.
- Government policies: Policy changes can strongly shape a sector’s overall outlook. For example, the Indian government’s focus on renewable energy has led to a significant rally in the stocks of companies in this space. Similarly, the ‘Make in India’ initiative has boosted the prospects of the domestic manufacturing sector.
- Competitive landscape: The intensity of competition within an industry affects the profit levels of its companies. A prime example of this is the Indian telecom sector, the entry of Reliance Jio in 2016 disrupted the entire industry. The intense price war that followed led to a significant erosion of profits for existing players like Bharti Airtel and Vodafone Idea. This, in turn, led to a sharp fall in their stock prices, making them undervalued in the eyes of some investors who believed in their long-term survival and recovery.
Common Pitfalls & How to Avoid Value Traps
When analysing undervalued stocks, several common mistakes can lead to misjudging opportunities, such as:
- Focusing only on low ratios: Relying solely on low P/E, P/B, or PEG ratios can be misleading. A stock may appear cheap, but declining revenues, shrinking margins, or hidden liabilities can make it a poor long-term investment.
- Ignoring sector context: Valuation metrics are meaningful only when compared with peers. A P/E that seems low in one industry may be high in another, leading to incorrect conclusions about relative value.
- Overlooking debt and cash flow: Companies with high debt or weak free cash flow may be financially strained, which low valuation ratios alone cannot reveal.
- Chasing “cheap” stocks: A stock trading at a low price might remain stagnant for years if fundamentals are weak or market interest is minimal.
- Neglecting qualitative factors: Management effectiveness, competitive positioning, and industry trends can significantly influence a company’s prospects, regardless of numerical indicators.
Example to find undervalued stocks
Now, how do you apply these metrics and avoid the common pitfalls in everyday search? Let’s see it in action. To find companies that are not just cheap but also fundamentally strong, we asked Stoxo to screen the market with a simple prompt: Suggest some undervalued stocks with a low P/E and consistent profit growth. Here’s a quick overview of the analysis it provided:
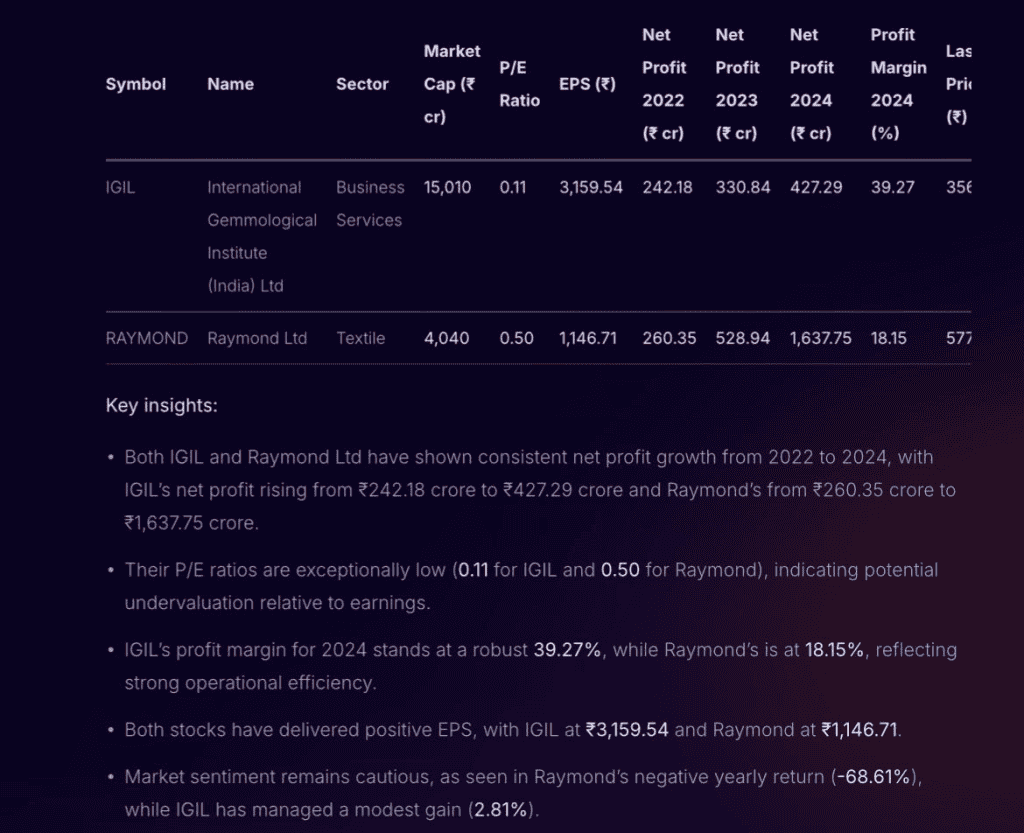
As you can see, the AI didn’t just find a low P/E ratio. It also confirmed strong, rising net profits for the companies shown. This is the main core. Combining valuation with fundamental health to spot a genuine opportunity, which may have become undervalued for reasons we’ll discuss next.
Why Stocks Become Undervalued
Stocks can appear undervalued for various reasons, often unrelated to their long-term fundamentals, including:
- Market overreaction to news: Negative headlines or short-term earnings misses can push prices down. For example, when Apple faced supply chain concerns in 2022, its stock dipped despite strong long-term prospects.
- Cyclical industry effects: Companies in cyclical sectors, like automobiles or commodities, may trade low during downturns even if their core business remains strong.
- Neglect by investors: Stocks in less popular sectors, such as small-cap industrial firms, can be overlooked, lowering demand and price.
- Temporary operational setbacks: Short-term issues like production delays or regulatory challenges can depress stock prices temporarily without harming intrinsic value.
- General market volatility: Broader market declines or economic uncertainty can make solid companies appear undervalued.
Conclusion
How to find undervalued stocks is about seeing opportunities others miss. By watching market trends, overlooked sectors, and subtle shifts, you can spot potential before it’s obvious. This approach turns careful observation into smarter choices, helping you focus on stocks that may offer real long-term value.
FAQ‘s
Metrics indicating undervaluation include low Price-to-Earnings (P/E) ratios (both trailing and forward), low Price-to-Book (P/B) ratios below 1, PEG ratios that balance valuation with growth, EV/EBITDA multiples, high dividend and earnings yields, manageable debt levels, and strong ROE, free cash flow, and ROIC. These metrics, when contextualized within sector norms, help identify stocks priced below their true value.
Intrinsic value is calculated using models like Discounted Cash Flow (DCF), which projects future cash flows discounted to present value, earnings-based valuation models considering expected growth and required returns, asset-based valuations comparing net assets, and qualitative factors such as management quality. Multiple models provide a balanced estimate of a stock’s true worth beyond current market price.
Trailing P/E uses a company’s historical earnings over the past 12 months to assess valuation, reflecting confirmed performance. Forward P/E estimates future earnings based on projections or analyst estimates, indicating market expectations. Comparing both helps gauge whether a stock’s valuation reflects anticipated earnings growth or past results.
Sector norms influence valuation since industries vary widely in growth, capital requirements, and profitability. A low P/E in one sector may be normal but undervalued in another. Market cycles, government policies, and competition within sectors impact investor sentiment and metrics, making it essential to compare stocks within their industry context to assess true undervaluation.
A value trap is a stock that appears cheap by valuation metrics but suffers from fundamental issues like declining earnings, poor management, high debt, or adverse industry trends. Avoid it by combining quantitative analysis with qualitative assessments, studying cash flows, debt, management strength, and competitive position to ensure the company has sustainable value.
Growth stocks may be undervalued when their price doesn’t fully reflect expected earnings growth, shown by a low PEG ratio. Identifying undervalued growth stocks requires evaluating future growth prospects relative to current valuation, ensuring the stock is priced attractively against its potential earnings expansion.
Advanced stock screeners that combine multiple metrics, P/E, P/B, PEG, EV/EBITDA, free cash flow, and debt are useful. AI-powered platforms like Stoxo provide comprehensive data, sector comparisons, growth analysis, and intrinsic value estimations, enabling a holistic assessment that helps investors spot overlooked undervalued stocks beyond simple number screening.

Leave a Comment