
While there are various tools to understand stock valuations, the PEG (Price/Earnings to Growth) ratio gets its uniqueness by factoring in the component of growth of companies over a period.
The PEG ratio is one of the mathematical tools used in stock valuations. Understanding different components of the PEG ratio helps investors and traders make the right decisions about the stocks they wish to invest in, the growth prospects of the stock, the profits they will reap and so on.
Keep reading to learn more about this ratio.
What is the PE ratio, and how is it calculated?
The full form of PE ratio is Price to Earnings Ratio, and it comprises the price of the share and earnings per share.
The price of the share is the market value of the share, and earnings per share, as the name suggests, is the earnings shareholders get on each share they hold.
The earnings per share (EPS), in simple words, is the company’s Profits / Number of shares outstanding.
EPS determines the portion of overall profit that belongs to each share held by shareholders.
The PE ratio helps you understand one of the essential questions while making an investment decision – Are you spending the right amount of money on a particular stock?
If you must earn ₹1 from the stocks of a company, what is the investment needed from your end? PE ratio helps you with this understanding.

A low PE ratio indicates that the amount you invest to earn ₹1 is low, which means your profit margins are higher.

A high PE ratio indicates that you must invest large amounts to earn ₹1 in the company, potentially reducing your profit margins.
While the ideal PE ratio differs from industry to industry, the ones below 20 are usually considered good investment options.
In terms of stock valuations, a high PE ratio may sometimes indicate that the stock is overvalued, and a low PE ratio shows that the stock is undervalued.
However, the PE ratio cannot be used as an independent tool in analysing stock market trends and should always be used in combination with other tools.
Calculating PEG ratio
PEG ratio consists of 3 components – Price/Market Value of the share, Earnings per Share and Growth Rate of Earnings per Share.
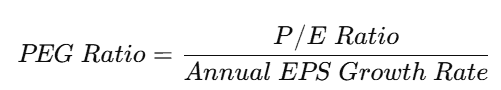
PEG Ratio Formula = PE Ratio / Growth of EPS
where PE Ratio = Price/ EPS
Investors can calculate the growth rate in two ways – Forward PEG or Trailing PEG.
Forward PEG is where analysts consider future projections of the company to calculate the growth rate. Under trailing PEG, the growth rate is calculated based on past trends.
What does the PEG ratio indicate?
The PEG ratio indicates the earning potential of a stock over a period.
A lower PEG ratio is considered a better investment option than a higher PEG ratio.
A low PEG ratio may indicate two things – One, the stock is currently undervalued; two, the stock has good potential to grow and yield good returns in the future.
Buyers prefer investing in an undervalued stock to make higher profits by selling it when prices rise.
So, while comparing the two companies, the stock with a lower PEG ratio is considered a better investment option.
A good PEG ratio
The accuracy of the PEG ratio depends on the inputs used in its calculation.
Suppose analysts using forward PEG to calculate growth rate may come up with a different ratio than those using trailing PEG to calculate growth rate.
So, it is difficult to determine the exact ideal ratio. Nevertheless, a good PEG ratio is generally anything below 1.
Example of PEG ratio calculation
Let us assume we have two companies from the same industry, with the data below:
Firm A:

Price per share: ₹35

Current year earnings per share: ₹3

Previous year earnings per share: ₹2.3

Firm B:

Price per share: ₹65

Current year earnings per share: ₹6

Previous year earnings per share: ₹5.8

Since we have the data for the past year, let us use the trailing PEG to calculate the growth rate.

Firm A:

PE Ratio: 35/3 = ₹11.66

Growth Rate: (3/2.3)-1*100 = 30.4%

PEG Ratio = 11.66/30.43 = 0.38

Firm B:

PE Ratio: 65/6 = ₹10.8

Growth Rate: (6/5.8)-1*100 = 3.4%

PEG Ratio = 10.8/3.4 = 3.17
Suppose we only use the PE ratio to understand the performance of a stock. In that case, Firm B’s stock would seem better than Firm A’s because the PE ratio of Firm B is lower, indicating a higher earning potential for each unit of money invested.
However, the above example proves that the PE ratio alone isn’t sufficient to analyse stock value as it doesn’t factor in the growth.
The comparison of EPS of 2 years shows that Firm A has a bigger potential to grow as compared to Firm B. The PEG ratio is also within the ideal range for Firm A, whereas the PEG ratio of Firm B indicates that the stock is overvalued.
So, the PEG ratio is considered a better indicator and based on that, Firm A’s stocks are a smarter buy.
Case study
Considering stocks of companies from the Financial Industry:
As of August 25, 2023 – The Ratios of Bajaj Finance and Aditya Birla Capital are as follows:
| Bajaj Finance | Aditya Birla | |||
| Stock | Peer Median | Stock | Peer Median | |
| P/E | 35.37 | 27.48 | 9.3 | 26.15 |
| P/B | 7.63 | 3.15 | 1.97 | 1.45 |
| Earnings Yield (%) | 4.76 | – | 8.68 | – |
| Dividend Yield (%) | 0.42 | 0.27 | – | – |
| PEG | 1.04 | – | 0.17 | – |
Both PE Ratio and PEG Ratio are lower for Aditya Birla as compared to Bajaj Finance making that a relatively better buy. But, remember looking at other financial aspects is also necessary when deciding on an investment.
What Is PEG Ratio?
The PEG ratio (Price/Earnings to Growth ratio) is a valuation metric used by investors to determine whether a stock is fairly valued based on its expected earnings growth. It improves upon the traditional P/E ratio by factoring in the company’s future growth potential.
In simple terms, the PEG ratio helps investors understand whether they are paying too much for a company’s growth. A company with strong growth prospects may appear expensive based on the P/E ratio alone, but the PEG ratio provides a clearer picture by adjusting for growth.
For example, if two companies have the same P/E ratio but one is growing earnings faster, the company with higher growth will generally have a lower PEG ratio, indicating better value.
Investors often use PEG ratio when comparing growth stocks, especially in sectors such as technology or emerging industries.
How To Calculate PEG Ratio
The PEG ratio is calculated by dividing the Price-to-Earnings (P/E) ratio by the expected earnings growth rate.
Example
- P/E Ratio of a company = 30
- Expected annual earnings growth = 15%
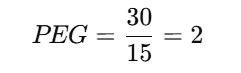
A PEG ratio of 2 suggests the stock may be relatively expensive compared to its growth rate.
Bottomline
We now know the PEG ratio is one of the essential tools in stock analysis and investment decisions. However, the numbers are influenced by factors, and these tools when used in isolation may not yield the desired results.
FAQ’s
PEG stands for Price/Earnings to Growth Ratio. It measures a company’s valuation while considering its expected earnings growth.
The PEG ratio is calculated by dividing the price-to-earnings (P/E) ratio by the expected annual earnings growth rate. This helps investors determine whether a stock’s price is justified by its growth potential.
A PEG ratio around 1 is generally considered fairly valued. A PEG below 1 may indicate that a stock is undervalued relative to its growth, while a PEG above 1 could suggest the stock is relatively expensive.