
In today’s stock markets, approximately 90% of trades are made by institutional trading accounts such as banks, hedge funds, or large investors. Most buying and selling pressure comes from these players. Order flow analysis can help you to understand their moves rather than guessing from price charts.
Whether you’re a beginner trying to understand trading mechanisms or an advanced trader looking to improve trades, this guide will show you why order flow matters and how order flow can transform your approach to market analysis and trading strategies.
What Is Order Flow Analysis?
Order flow analysis is the study of the real-time movement of how buy and sell orders are executed in the stock market to predict price movements. It is a trading strategy or methodology used by traders for analysing supply and demand in the market.
Order flow analysis tracks the volume and price movements of each trade to gather insights instead of relying on historical data and past performance. With the use of specialised order flow tools, traders can spot opportunities and make informed decisions regarding entry or exit in trades.
In easy words, it can be said that, when price moves, order flow analysis questions ‘who pushed it’, whether it’s the buyers hitting orders or the sellers putting bids.
Why Order Flow Matters: Supply & Demand in Real Time
As discussed earlier, institutional investors dominate volume in the stock market as of 2025. Approximately 70-90% of daily trading volume is driven by big institutional players such as hedge funds, mutual funds, and professional traders, whereas retail participation is relatively low.
Order flow analysis helps traders to see buying and selling pressure build up prior to major moves taking place, instead of waiting for traditional indicators to react after the price changes.
Why it matters:
Insights on Big Players’ Movements: It provides insights on where the large traders are placing their orders, which helps new or average traders to anticipate price movements. Institutional and professional traders look for liquidity. By analysing order flow, traders can understand where these big players are positioning themselves. For example, observing sudden high bids at the support level indicates institutions taking their positions and suggests prices might bounce.
Helps to Identify Key Liquidity Zones: Order flow analysis helps traders to identify key liquidity zones, such as where prices are likely to pause, reverse, or break through. These zones act as gravity points for price actions and are significant for taking profits or setting stop losses. For example, a large number of sell orders at a resistance level might indicate strong sellers in the area, which makes it hard for prices to break through.
Allows Precise Entry and Exit: Unlike traditional lagging indicators, order flow allows an entry and exit with more conviction, backed by evidence of real-time buying or selling pressure rather than just historical price patterns. This reduces the chance of getting fooled by false breakouts or traps. For example, a stock is approaching a resistance level, and there is a significant rise in buy orders, breaking through resistance. This could suggest a potential entry point for a long trade.
Key Components & Tools
For effective order flow analysis, data and visualisation tools are necessary. Now, traders can upgrade the traditional tools using stock market AI, which scans and processes huge datasets, detects unusual order activities, highlights key zones, and even forecast large player movements.
Order Book / Depth of Market (DOM)
Order book, also known as Depth of Market (DOM), shows real-time buy and sell orders waiting at different price levels for the traders, for example, how many contracts or shares are bid, how many are offered, and at what price. It draws out a live map of pending supply and demand. Scalpers must understand where liquidity exists or the price may pause.
Level II Quotes & Time & Sales
Level II Quotes provides detailed price tiers beyond the best bid and ask, and shows market participation queues. Time and Sales displays real trades that are executed, in sequence, including size and price.
These tools help traders to confirm real or fake orders in the book and avoid being misled.
Footprint Charts & Heatmaps
Footprints charts show volume at bid and ask, by displaying executed trades directly on candlesticks. Whereas heatmaps highlight large order clusters and visualise liquidity. These tools make it easy for traders to identify imbalances, exhaustion, or absorption at complex levels.
Volume Delta, Order Flow Imbalance, Bid-Ask Spread, VWAP
These advanced metrics provide clarity in order flow analysis:
- Volume Delta: Volume delta draws out the difference between buy and sell orders in the market at each price.
- Order Flow Imbalance: This highlights which side dominates the market, for example, buyers dominating the sellers.
- Bid-Ask Spread: Bid-Ask Spread could mean two things. When spreads are narrow, it suggests high liquidity, and wide spreads suggest uncertainty.
- VWAP: Volume Weighted Average Price (VWAP) is used by the institutions to measure the fair value of stocks. Price trades above VWAP signal a bullish market, whereas price trades below VWAP suggest a bearish market.
Order Flow Strategies & Signals
Certain order flow strategies and signals that traders need to know include:
- Liquidity: Here, the traders focus on large orders at key price levels and, by anticipating reversal, enter just before liquidity gets taken.
- Absorption: This strategy talks about looking out for large orders getting filled, with no change in price. This indicates large players are accumulating positions.
- Exhaustion: Exhaustion takes place when either the buy orders’ or the sell orders’ side of the market is dominating, but the participation drops. However, prices still keep moving, even though trade volume reduces. This indicates a fading momentum, which might be beneficial for profit-making.
- Stop runs: Institutions and trading firms often push prices to move out of retail traders. This strategy helps traders to spot stop-loss areas and enter once the market snaps back.
- Iceberg: Large traders often diversify their orders into small parts in order to avoid detection. Using time and sales data, traders can spot these hidden trades and their frequency.
- Reversal at liquidity: This strategy looks out for aggressive buy and sell orders at strong liquid zones, and thereby entering a trade when the price indicates a sign of exhaustion at these key levels.
Integrating Order Flow with Technical & Volume Analysis
Integrating order flow with technical and volume analysis provides stronger results and better decision-making. Here are some ways how traders can incorporate key components of these three types of analysis:
- Using the volume profile to find high liquidity zones.
- Combining the Depth of Market (DOM) with candlestick charts.
- Confirming support and resistance levels by checking whether buyers or sellers defend them in real-time.
The integration of these three types of analysis creates a powerful framework for balancing micro and macro trends.
Backtesting & Validating Order Flow Strategies
Back-testing order flow strategies can be challenging due to their dynamic nature. As order flow constantly changes, most independent traders do not use tested or quantified systems, further complicating the process.
However, there’s an indirect approach to this concern. It is a long-standing method in the New York Stock Exchange (NYSE) that uses the daily opening and closing bids rather than real-time order flow data.
- Open-Only Orders (OPG): Traders submit the orders before the market opens. These are executed at the opening price, so traders lock in as the market opens.
- Market-on-Close Orders (MOC): Traders send the orders before the market closes. They execute at the closing price, letting traders position or exit right before the day’s final point.
In this method, the opening price is determined by the balance of supply and demand. If the sellers are higher than the buyers before the market opens, the price is likely to be lower, and vice versa. The market makers are responsible for matching the number of orders to achieve equilibrium.
Starting Out: Tools, Software & Data Sources
Starting out, order flow analysis requires the following:
Essential Tools for Order Flow Analysis: Footprint Chart, Volume Profile, Depth of Market (DOM), Market Delta, and Power Trades are essential tools for order flow analysis. These provide visibility into the number of orders, shifts in volume, and price movements, allowing traders to access real-time market updates.
Order Flow Analysis Software: Traders can choose from a range of platforms like Stoxo, Bookmap, ATAS, Sierra Chart, NinjaTrader with Orderflows Trader, and GoCharting, that convert raw data into visuals. These platforms can map the order book, executed trades, and liquidity changes, which enables traders to identify buyer and seller imbalances, evaluate trends, and identify optimal entry or exit.
Data Sources: Order flow analysis can access data from tools such as Stoxo, ATAS, GoCharting, and OEC Trader. Key data formats include footprint or cluster charts, time and sales, order books, or DOM.
Common Mistakes & How To Avoid Them
- Overanalysis of trades: Traders should focus on key levels and major signals rather than market noise.
- Using inadequate tools: Traders should equip themselves with the right order flow platforms and tools for proper data interpretation.
- Overtrading: Traders should avoid excessive trading and stick to high-potential setups and a clear structure.
- Ignoring risk management: Trades should always define trades’ size, set stop losses, and follow them to manage capital and profits.
Case Studies / Real-World Example Trades
- Bullish Order Block 15 minutes TF: A 15-minute bullish order block on Gold Spot/USD shows price reversed upward after falling into a demand zone. The green box indicates the buy zone, with the entry point above and a stop-loss below, signaling high-conviction institutional buying.
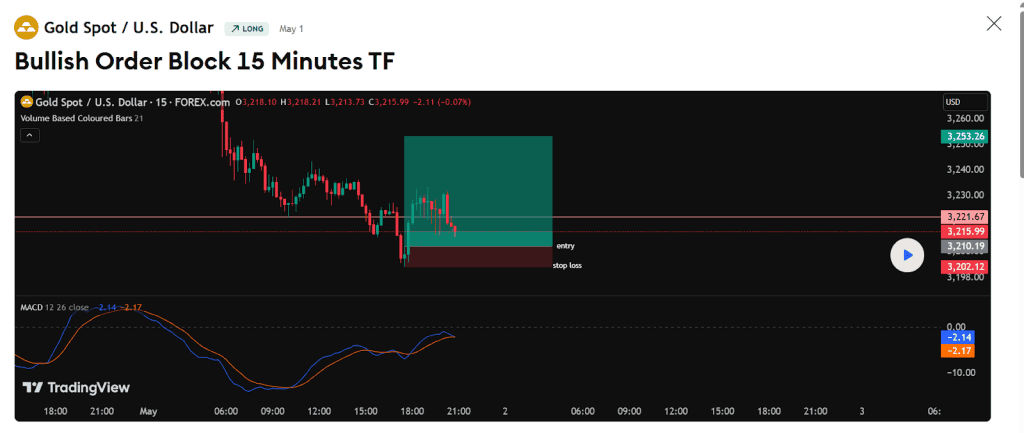
This chart shows a bullish order block on Gold/USD, indicating an expected upward bounce from the demand zone.
- Significance of delta negative count at a lift time high: Gold Spot/USD’s 75-minute footprint shows price near recent highs, but negative delta and aggressive selling suggest fading buyer momentum and potential institutional distribution. This setup warns of a possible stall or reversal, advising tighter stops or profit-taking.
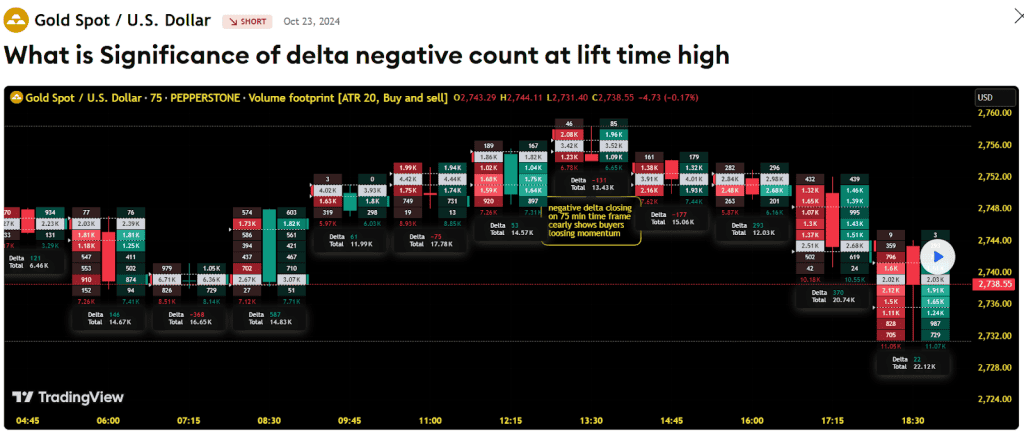
This image shows negative delta at new highs, indicating weakening buyer strength and potential trend reversal despite rising prices.
Risk Management & Execution Considerations
Order flow analysis is a fast-paced practice, and carries potential risks:
- Traders should always use stop losses to protect capital.
- Defining entry and exit signals before every trade is essential.
- Traders can use market orders to immediately fill in fast-moving markets.
- Traders should size positions according to their risk appetite.
Conclusion
Order flow analysis provides traders with a real-time view of the market supply and demand by tracking real orders instead of historical data. Combining this with solid execution plans and risk rules can shift the trading edge.
However, it’s not magic; it demands discipline, good tools, and realistic expectations. If these are used efficiently, order flow can make trading smarter and not harder.
FAQs
Order flow analysis is a study of real-time order activity, such as buys, sells, and cancellations, to analyse drivers of the market. Order flow provides insights for the future while technical analysis confirms patterns.
Footprint Chart, Volume Profile, Depth of Market (DOM), Market Delta, and Power Trades are essential tools and data for order flow analysis.
Order flow imbalances take place when buy orders are higher than sell orders or vice versa. It gives insights regarding the current drivers of the market, for example, if the buy orders are high, it is likely to push the price higher. And if sell orders are more, it shall bring the price down.
Liquidity: Traders anticipate reversals by focusing on large orders at key price levels, entering just before liquidity is taken.
Absorption: Large orders filled with no price change suggest large players are accumulating positions.
Stop runs: Institutions push prices to trigger retail stop-losses; traders identify these areas and enter when the market recovers.
Exhaustion: Exhaustion occurs when one market side dominates, but participation drops. Despite reduced trade volume, prices still move, indicating fading momentum, which can be profitable.
In order flow analysis, footprint charts show the executed buy and sell orders at different price levels, while Depth of Market (DOM) shows pending orders. Traders can use footprints charts to understand which side is dominating and the DOM to watch the support or resistance of the price for pending orders.
As order flow analysis works with key details, speed and spread are significant. If there is latency, it may lead to stale data, slippage might consume profits, and transaction costs will increase.
Order flow backtesting can be challenging. Order flow goes through rapid changes, and coping with that is an essential factor. But traders may consider Open-Only Orders (OPG), which are submitted before market open and executed at the opening price, and Market-on-Close Orders (MOC), submitted before market close and executed at the closing price.
Order flow analysis is for intermediate to advanced traders. However, with the right approach, beginners can execute it as well. Beginners can start observing price movements and volume, and slowly incorporate order flow tools.

Leave a Comment