Summary
Most retail traders look at what price did. Order flow traders look at what’s about to happen by watching the actual buy and sell orders stacking up in real time.
It’s like seeing the kitchen before the meal arrives at the table.
This guide walks you through the key indicators, how they work, and where beginners should start without getting overwhelmed.
What is an Order Flow Indicator?
An order flow indicator is any tool that helps you see the actual buying and selling pressure behind a price move not just the result of it. Traditional charts show you that a stock went from ₹540 to ₹548. Order flow shows you that 3,200 contracts hit the ask price aggressively (buyers initiating) while only 1,100 hit the bid (sellers initiating). That imbalance tells you something the price bar alone never could who’s driving this move and how hard they’re pushing.
Think of it as looking under the hood of the price action. For a broader breakdown of the concept and its applications, order flow analysis goes into more detail. What matters right now is understanding that order flow isn’t replacing your chart it’s adding a layer of information that price-based indicators simply can’t provide.
How Order Flow Trading Works in the Stock Market
Every trade needs a buyer and a seller. But there’s a difference between someone placing a passive limit order (“I’ll buy at ₹540 if it comes to me”) and someone firing a market order (“I want in right now at whatever price”). Order flow analysis tracks that distinction. Aggressive market orders the ones that hit the bid or lift the ask are where the intent lives. Someone paying the spread to get filled immediately is showing urgency, and urgency moves markets.
On Indian exchanges, this data comes from the order book the live queue of bids and asks at every price level. Watching how that queue fills, drains, or gets pulled (orders cancelled before they’re hit) gives you a real-time picture of supply and demand that no lagging indicator can match.
Order Flow vs. Volume Indicators
The key distinction is timing and granularity. Volume tells you how many shares traded after the fact. Order flow tells you how they traded who was aggressive, at which price levels, and in what direction. For more on how the underlying data structures differ, order book vs trade book is a useful read.
| Feature | Order Flow Indicators | Volume Indicators |
| What it shows | Real-time buy/sell aggression at each price level | Total shares/contracts traded in a period |
| Timing | Live updates with every order | After-the-fact summarised per candle |
| Granularity | Price-level detail (who’s hitting bid vs ask) | Aggregate one number per bar |
| Best for | Spotting institutional intent and imbalances | Confirming trend strength and divergences |
| Learning curve | Steeper needs specialised tools | Easier built into every charting platform |
| Data access | Often requires premium feeds | Free on most platforms |
Most Popular Order Flow Indicators Traders Use
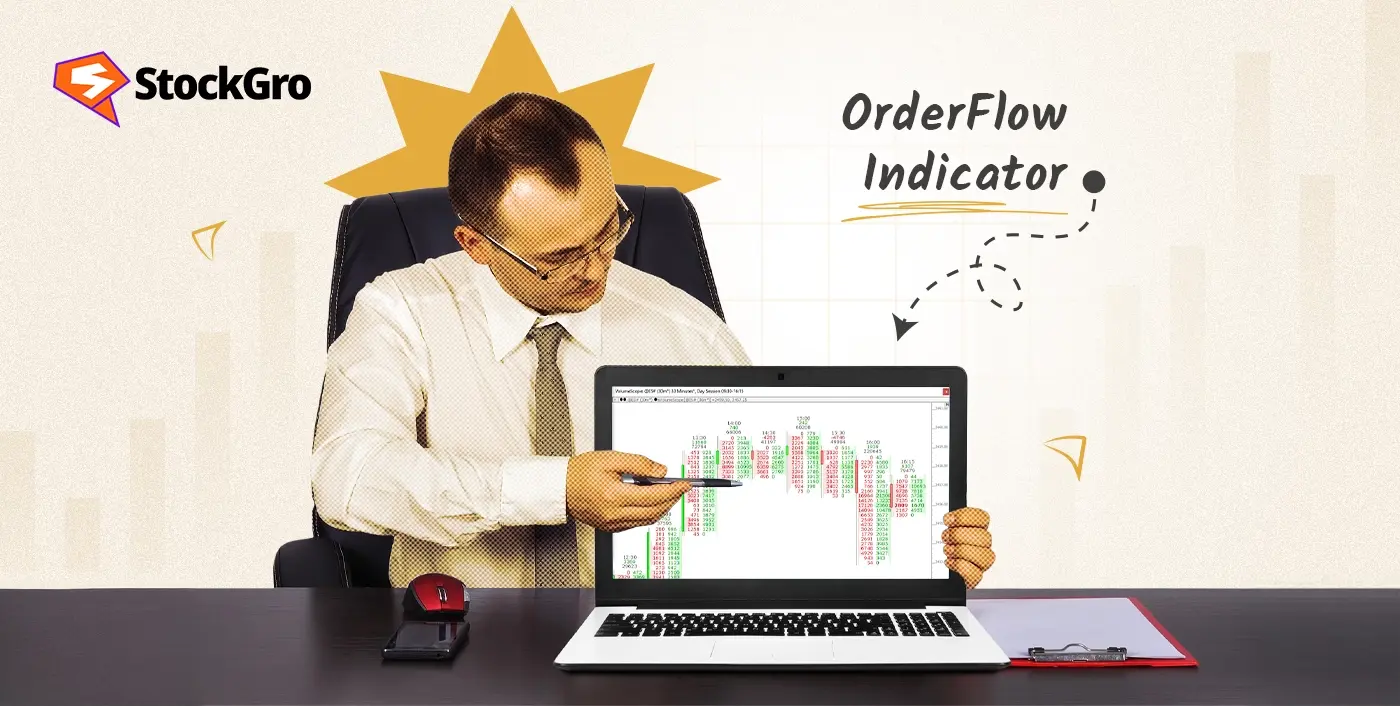
Footprint charts: These break each candle into price levels showing exactly how many contracts traded at the bid vs the ask. If 2,500 contracts lifted the ask at ₹548 but only 400 hit the bid, that level saw aggressive buying. Footprint charts are the closest thing to seeing the market’s heartbeat in real time.
Delta: The net difference between buy-initiated and sell-initiated volume. Positive delta means buyers were more aggressive. If a candle shows a delta of +1,800 on Nifty futures, that’s 1,800 more contracts initiated by buyers than sellers during that period. Simple number, powerful signal.
Cumulative delta: Tracks delta across multiple candles to show the bigger picture. Price making new highs while cumulative delta is falling? Buyers are getting weaker even though price is still climbing. That divergence often precedes a reversal.
Order book heatmap (DOM): A visual representation of limit orders sitting at every price level. Large clusters of orders act as walls support from below, resistance from above. Watching these walls build or get pulled gives you clues about where price is likely to stall or break through.
Key Components of Order Flow Analysis
Aggressive orders: These are the market orders the ones actively hitting the bid or lifting the ask. When someone fires a market order, they’re saying “I want in (or out) right now, I don’t care about the spread.” That urgency is where the real buying or selling intent lives. A surge of aggressive buy orders lifting the ask at a specific price level tells you real demand is stepping in, not just passive interest.
Passive orders: These are the limit orders sitting quietly in the order book, waiting to be filled. A big cluster of passive buy orders at ₹49,950 on Bank Nifty acts like a floor someone with deep pockets is willing to buy everything thrown at that price. Watching where these clusters build (and more importantly, where they suddenly get pulled) tells you where the big players are drawing their lines.
Absorption patterns: This is where it gets really interesting. When heavy aggressive selling hits a large passive buy order and the price barely drops that’s absorption. A big buyer is quietly swallowing all the supply without letting the market fall. It’s one of the strongest order flow signals out there, because when the sellers finally exhaust themselves, the price typically snaps upward off that absorbed level.
How Beginners Can Use Order Flow Indicators Effectively
Start with delta. Seriously, just delta. Ignore footprint charts, ignore heatmaps, ignore everything else for now. Pull up Nifty futures on a 5-minute chart and add a delta indicator. Watch whether the delta is positive or negative on each candle, and notice how it relates to price direction. When price goes up and delta is strongly positive real buying. When price goes up but delta is flat or negative the rally doesn’t have buyer backing. That one observation, practised daily for a few weeks, gives you more insight than trying to read a full footprint chart from day one.
Once delta feels intuitive, add cumulative delta. Track whether the running total is rising or falling alongside price. Divergences between the two price up, cumulative delta down are your first actionable signals. Keep it simple. The complexity can come later.
Order Flow Trading Strategies
Absorption entry: Watch for a price level where aggressive sellers keep hitting the bid but the price refuses to drop. That’s a large passive buy order absorbing all the supply. When the selling dries up, enter long with a stop just below the absorption level. On Bank Nifty, you might spot this at a round number like ₹50,000 heavy selling, price holds, delta starts flipping positive. Buy ₹50,020 with a stop at ₹49,950 and a target of ₹50,150.
Delta divergence fade: Price makes a new high on the 5-minute chart but delta on that candle is weaker than the previous high’s delta. The move is losing buyer conviction. Enter short on the next candle’s open with a tight stop above the high. This works best during the mid-session lull (12–1:30 PM) when fake breakouts are common.
Benefits of Using Order Flow Indicators in Trading
See intent before price moves: Order flow shows you the buying or selling pressure building at a level before the breakout or breakdown actually happens. You’re not reacting to a move you’re anticipating it based on where the aggressive orders are clustering.
Filter fake moves: A breakout on thin order flow (low delta, few aggressive orders) is likely to fail. A breakout with heavy aggressive buying and the ask-side being swept clean is genuine. That filter alone saves you from chasing traps.
Works in any market condition: Trending, ranging, volatile, quiet order flow data is useful in all conditions because you’re reading actual participant behaviour, not a mathematical formula derived from past prices.
Common Mistakes Traders Make with Order Flow Analysis
Trying to learn everything at once: Footprint charts, delta, cumulative delta, DOM, heatmaps it’s overwhelming. Pick one tool. Master it. Then add the next. Most traders who abandon order flow quit because they tried to drink from the fire hose on day one.
Ignoring the macro context: A bullish absorption at ₹50,000 on Bank Nifty means less if the broader market is in free fall after a global sell-off. Order flow gives you micro-level precision, but you still need to check whether the macro environment supports your trade.
Over-reading every tick: Not every bid-ask imbalance is a signal. Some are just noise normal market-making activity, algorithm pings, or orders that get cancelled milliseconds later. Look for sustained patterns, not isolated blips.
How to Start Learning Order Flow Trading with Confidence
Paper trade first no exceptions. Load up a demo account with Nifty or Bank Nifty futures, add a delta indicator to your 5-minute chart, and take simulated trades for at least a month. Journal every trade: what did the delta show, what did you expect, what actually happened. That feedback loop is where the real learning lives.
Free resources exist. TradingView’s community has delta scripts you can add without paying for premium feeds. YouTube has excellent walkthroughs of footprint chart reading. But here’s the thing watching tutorials isn’t the same as watching a live chart. Set aside 30 minutes during market hours to just observe. Don’t trade. Just watch the delta and price interact. That screen-time builds intuition no course can replicate.
Pros and Cons of Order Flow Indicators
Pros
Real-time edge over price-based tools: You’re seeing what’s happening right now aggressive orders, absorption, delta shifts not what happened three candles ago. That timing advantage is massive in fast-moving intraday markets where a few seconds of head start can define the trade.
Exposes hidden institutional activity: Accumulation and distribution by big players don’t show up on regular price charts until the move is well underway. Order flow catches them earlier through absorption patterns and delta divergences, giving you a window into smart-money positioning before it hits the tape.
Strengthens every other signal you use: Adding order flow as a confirmation layer makes your RSI, MACD, and moving average setups significantly more reliable. It answers the one question those indicators can’t: is there real money and real urgency behind this move?
Cons
Data access costs money: Quality tick-level data for Indian markets usually requires a paid subscription or a premium platform. Free charting tools rarely provide the bid-ask level granularity that order flow analysis depends on.
Steep learning curve: Reading a footprint chart or DOM effectively takes months of daily practice. It’s not something you absorb from a single article or a weekend crash course you need real screen-time watching live markets.
Not available for all instruments: Order flow works best on liquid futures contracts like Nifty and Bank Nifty. Options, small-cap stocks, and thinly traded instruments don’t generate enough order data for the patterns to be meaningful.
Common Mistakes to Avoid
Treating order flow as a standalone system: Order flow tells you about supply and demand at a specific price level. It doesn’t tell you the trend direction, the broader sentiment, or whether earnings are due tomorrow. Always use it alongside a structural view of the market support/resistance, trend direction, and key events.
Overtrading on every imbalance: You’ll see dozens of delta spikes and order book shifts in a single session. Most of them are noise. Wait for setups where order flow confirms a price level you’ve already identified as significant. The combination is what creates high-probability trades not the order flow data alone.
Skipping the observation phase: Jumping straight into live trades because you watched a YouTube tutorial is a fast way to lose money. Order flow requires screen-time and pattern recognition that only develops through weeks of watching live markets. There are no shortcuts here.
Conclusion
Order flow indicators give you something most retail tools don’t a live window into who’s buying, who’s selling, and how hard they’re pushing. That’s powerful information, but only if you’re willing to put in the practice time to read it correctly. Start with delta on a single instrument. Watch it for a month. Journal what you see. Then gradually layer in cumulative delta, footprint charts, and absorption patterns as your reading improves. The traders who get real value from order flow aren’t the ones with the fanciest tools they’re the ones who spent enough screen-time to know what normal looks like, so they can spot the moments that aren’t normal at all.
FAQs
They show the real-time buying and selling pressure behind price moves who’s aggressive, at which levels, and how strong the conviction is. This helps you confirm whether a move is genuine or likely to reverse.
Yes, but start with just delta on a 5-minute chart. Don’t try footprint charts or DOM heatmaps on day one the learning curve is steep enough that simplicity is essential early on.
Delta, cumulative delta, footprint charts, and the DOM (depth of market) heatmap. Delta is the most accessible starting point; footprint charts offer the deepest granularity.
Technical analysis uses price-derived formulas (moving averages, RSI) to generate signals. Order flow reads the actual buy/sell orders in real time, showing intent before it fully shows up in the price.
No they show where pressure is building, not where price will definitely go. They’re strongest as confirmation tools alongside your existing analysis, not as standalone predictors.
Yes, it’s arguably most useful for intraday. The real-time nature of order flow data aligns perfectly with the short decision windows of day trading, especially on liquid instruments like Nifty and Bank Nifty futures.
Trying to learn all tools at once, overtrading on every delta spike, ignoring broader market context, and skipping the observation phase before going live. Patience and simplicity win early on.
Paper trade on a demo account with Nifty futures for at least a month. Add a delta indicator to a 5-minute chart, journal every observation, and don’t risk real capital until your pattern recognition feels consistent.