Most beginners start researching stocks by jumping between charts, news, and ratios, hoping something will ‘click’. After a while, this scattered approach shows its limits, as important signals are missed, trends look unclear, and decisions start relying more on instinct than insight. That’s when the role of stock analysis tools begins.
Stock analysis tools are digital platforms or metrics that simplify market data through screeners, charts, and fundamentals. It helps the traders to identify price trends and the investors to evaluate company fundamentals with more clarity.
This blog breaks down what stock market analysis tools are, how to pick the right one, and where beginners might go wrong, to approach the market with clarity rather than guesswork.
What Are Stock Analysis Tools?
Stock analysis tools are software or financial metrics that help investors evaluate stocks and make informed investment decisions. These include technical analysis tools, which use charts, indicators, and patterns to forecast price movements based on historical data, and fundamental analysis tools that evaluate a company’s health.
Top Stock Analysis Tools (Comparison)
The tools like Stoxo, StockEdge, and TradingView provide AI-powered, data-driven platforms, while the tools LevelFields and Stock Rover are more into traditional stock analysis, each having a unique focus to provide useful insights.
Tool 1: Stoxo
Stoxo is an AI-powered stock research platform with a focus on the Indian stock market. Its key features include providing insights with conversational and natural language commands, structured and researched answers backed by SEBI-registered analysts, and real-time market analysis.
Tool 2: StockEdge (Indian context)
StockEdge is a stock market analysis application that focuses mainly on Indian stocks, mutual funds, and indices on NSE and BSE. It combines fundamental and technical analysis with integration of brokers and provides ready-made IPO analysis, stock screeners, and FII-DII activity tracking.
Tool 3: TradingView
TradingView is a global charting and social networking platform that offers global charting and social features, including customisable charting tools, a wide range of alerts, and a platform to share ideas and research.
Tool 4: LevelFields
LevelFields is a stock analysis and screening platform. It offers real-time market data and tools for active traders. It aims to combine trading strategies with institutional-grade tools and provide community-driven insights and tools for tracking stock prices, options flow, and market activity.
Tool 5: Stock Rover
Stock Rover is a global stock analysis and screening tool, with a focus on fundamental and technical analysis. It helps in identifying investment opportunities based on different criteria, and provides tools for research and portfolio tracking.
Here’s a quick comparison between the above-mentioned tools:
| Tools | Use | Features |
| Stoxo | AI-powered stock research platform for the Indian stock market | Provides insights, structured and researched answers backed by SEBI-registered analysts, and real-time market analysis with natural language commands |
| StockEdge | Stock market analysis app, with focus on Indian stocks, mutual funds, and indices on NSE and BSE | Combines fundamental and technical analysis with integration of brokers, provides ready-made IPO analysis, stock screeners and FII-DII activity tracking |
| TradingView | Global charting and social networking platform | Offers global charting and social features, including customisable charting tools, a range of alerts, and platform to share ideas and research |
| LevelFields | Stock analysis and screening platform | Real-time market data and tools for active traders, and combine trading strategies with institutional-grade tools |
| Stock Rover | Global stock analysis and screening tool | Focus on fundamental and technical analysis, and provides tools for research and portfolio tracking |
Case Study: Analysing an Indian Stock Using the Tool
Here’s a case study of how AI stock analysis tools, like Stoxo, can present analysis of Indian stocks.
After running the prompt, “I want to invest in the solar energy market, and I’m interested in this stock of Zodiac Energy Limited. Help me analyse them, as I’m still just a beginner”, the AI tool quickly broke down the solar energy sector, highlighted its top players, and placed Zodiac Energy in context with the market.
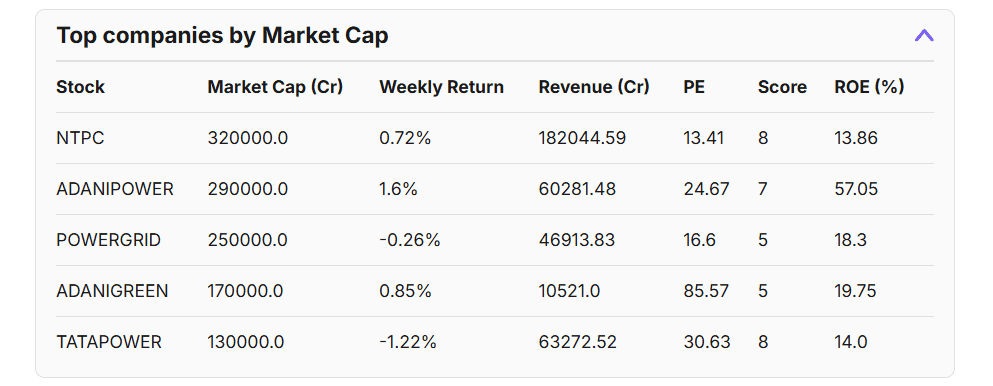
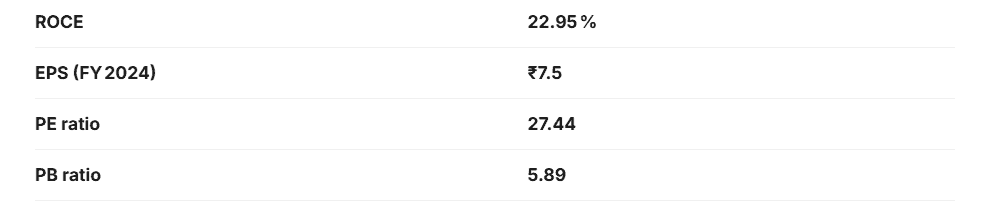
Then, Stoxo converts the raw financials, such as revenue, profit, margins, PE, PB, and ROE, into beginner-friendly insights by explaining what each number signals and where the risks might be lying.
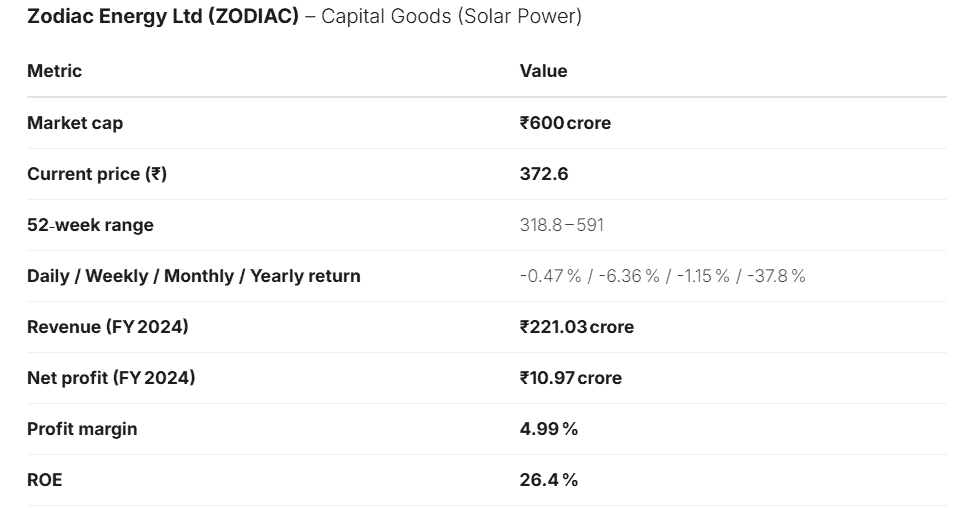
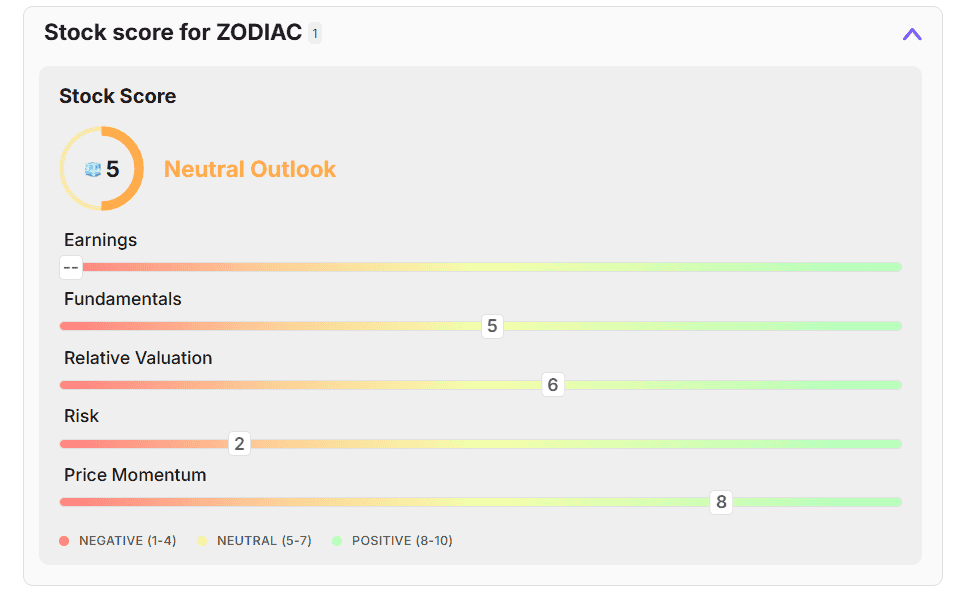
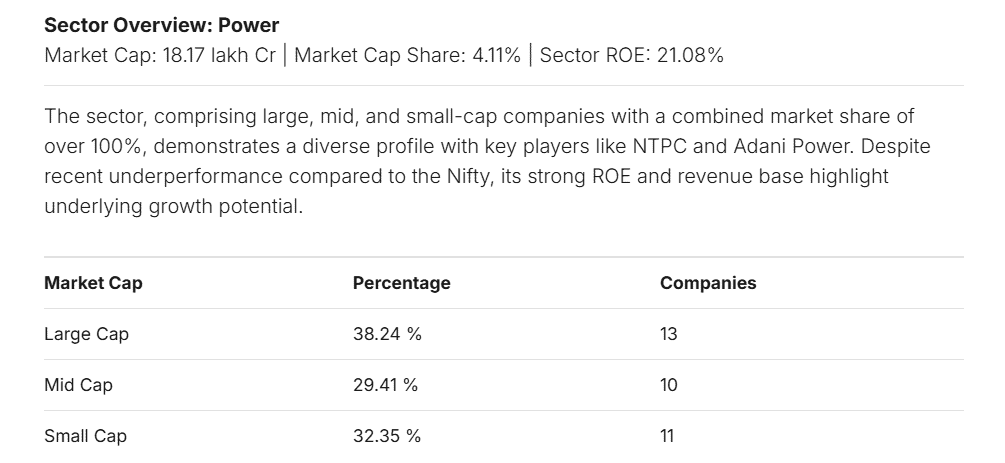
The stock score, mentioned below, summarises everything into a clear view, helping a new investor understand if the company fits their risk level and expectations.
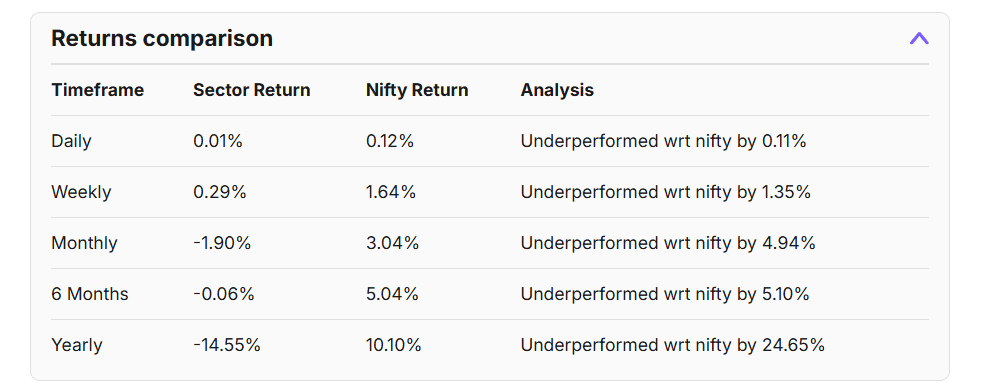
The data above shows how a stock analysis tool, Stoxo, summarises the sector trends, company fundamentals, valuations, and momentum into a structured view, which makes research faster and a little less overwhelming for beginners.
Common Mistakes When Relying on Tools
- Ignoring Qualitative and External Factors: The stock analysis tools focus mainly on quantitative data, such as financial ratios, price movements, and trading volumes, and overlook qualitative factors and external factors, such as management quality, competitive advantage, and economic trends.
- Reliance on Historical Data: The stock analysis tools use historical data to identify trends and patterns, and might assume that past performance is a guaranteed indicator of future results.
- Emotional Decision-Making and Lack of Discipline: The new investors or traders might let emotions like fear, greed, and hope take over their decisions, leading to chasing after hype or panicking and selling during market downturns.
Why These Tools Matter for Investors & Traders
- Data-Driven Insights: The stock analysis tools process a huge amount of financial data, market trends, and historical performance and provide actionable insights, which help investors and traders identify potential opportunities and risks.
- Risk Management & Strategy: The stock analysis platforms enable effective portfolio monitoring and risk analysis by providing technical tools and metrics to evaluate volatility, and help in aligning strategies with risk tolerance.
- Efficiency & Objectivity: The AI-automated tools analyse and present complex information clearly, and save significant amounts of time, while helping to avoid emotional biases in the decision-making process, leading to objective choices.
Key Features to Look for in Stock Market Analysis Tools
The stock analysis tools help investors to conduct both technical and fundamental analysis to make more informed trading decisions. Here are some important features investors should look for in stock market analysis tools!
Real-time data & alerts
The stock analysis tool provides quick access to live market data for timely decision-making and allows investors and traders to set up alerts for price movements or certain events.
Screeners & filters (fundamental + technical)
Stock analysis tools should enable filtering of stocks based on customisation, including both fundamental and technical factors. This allows the traders or investors to find stocks that meet their investment goals and risk acceptance level.
Charting & technical indicators
Stock analysis platforms usually provide charting facilities with tools like Moving Averages, Moving Averages Convergence and Divergence (MACD), Relative Strength Index (RSI), and Bollinger Bands. These tools help in analysing the price movements, trends, and trading volumes.
Fundamental analysis dashboards (financials, ratios)
Stock analysis platforms provide accessibility to financial statements, including the balance sheets, income statements, and cash flow statements, and financial ratios, such as P/E, EPS, ROE, and debt-to-equity ratios, for fundamental analysis of a company.
AI/automation & risk analytics
There are AI-backed stock analysis tools like Stoxo and StockEdge that use AI and machine learning to identify trends, make predictions, and provide insights. These also include tools for risk analytics, which help in managing and understanding potential market risks.
Bottom line
Stock analysis tools can cut through market noise and give a structure to the research. These tools help the investors and traders to compare companies, study trends, and judge risks with more clarity than any scattered browsing.
Whether a trader looks for chartings or an investor studies fundamentals, these platforms aim to make the process sharper, faster, and more disciplined, and with the right toolset, the decisions will rely on evidence, and not instinct, which opens the door to confident investing.
FAQ‘s
The best stock market analysis tools for beginners might prefer platforms that simplify data, offer ready-made screeners, and present information in a clean layout. These platforms, such as Stoxo, StockEdge, TradingView, Stock Rover, and LevelFields, are the top tools used for stock analysis.
Yes, there are many free platforms that provide charts, basic fundamentals, news, and screeners. The paid tools become helpful only when the investors need advanced filters, alerts, portfolio tracking, or other specialised research features.
Investors or traders should look for real-time data, screeners, charting tools, fundamental dashboards, and risk-tracking features, which help them to study the companies from multiple angles before making decisions.
The investors can set filters based on what they want, such as low debt, high ROE, strong earnings growth, or bullish price trends. The screener will shortlist stocks that match their criteria, making the research process faster and more structured.
The AI-powered tools, like Stoxo, are useful for speed, structure, which reduces human errors. Investors can use them as an assistant to verify important factors like management quality, competitive strength, and long-term prospects on their own.
The platforms like Stoxo, StockEdge, and TradingView work for the Indian stock market. These tools offer India-specific data, screeners, and sector coverage that suit both beginners and experienced investors.
Investors can refresh once or twice a day for long-term investments. And the traders who rely on short-term moves usually check data more frequently, depending on the volatility and market activity.

Leave a Comment