The National Stock Exchange of India saw daily turnover touch ₹1.11 lakh crore in June 2025, showcasing the rising scale of market activity.
Yet, many investors face difficulties not because they pick the wrong stocks, but because they fail to time their entry and exit correctly. A strong company’s stock can still drop if bought at the wrong moment. That’s why technical analysis is vital, it helps traders study price charts, identify support and resistance, and spot trading patterns to understand market trends
So, how to do technical analysis of stocks? Let’s learn all about it in detail in this blog.
How to Do Technical Analysis of Stocks
Understanding technical analysis does not have a quick cheat sheet to stick to. Reading charts, patterns, and indicators often confuses beginners. This is where stock market AI tools like Stoxo by StockGro help by turning real-time data into easy-to-read insights. Still, good technical analysis always relies on some core elements, such as:
- Types of Technical Analysis Approaches
There are two major styles traders use to analyse markets:
Top-Down vs Bottom-Up
- Top-Down: Start with macro-factors (economy, interest rates, inflation), then move to sectors and finally individual stocks or assets. Helps you align with broader trends and avoid fighting headwinds.
- Bottom-Up: Focus first on individual price action, chart patterns, momentum, etc. Sector or macro views may come later but are secondary. Good for spotting opportunities others may miss if they’re too focused on the big picture.
Many traders combine both top-down to filter sectors in favour, then bottom-up on those sectors for entries.
- Key Charting Tools & Patterns
The following are tools & patterns that visual chart analysis frequently uses, such as those listed as follows.
- Candlestick & Chart Patterns
Candlestick and chart formations provide early signs of reversals or continuations, including:
- Head and shoulders: A reversal pattern that forms after an uptrend, marked by three peaks, the middle one higher than the other two. When the neckline breaks, it often signals a trend reversal.
- Double tops/bottoms: Double tops appear after an uptrend with two failed attempts to break higher, indicating bearish reversal. Double bottoms are the opposite, showing support after two retests, often leading to bullish reversals.
- Cups and handles: A bullish continuation pattern where the price forms a rounded “cup” followed by a small downward “handle,” before breaking out higher.
- Trendlines, Support & Resistance, Pivot Points
Market structure is often framed using simple reference tools such as:
- Trendlines: Drawn by connecting key highs or lows, trendlines highlight the prevailing direction of the market. Consistent touches without breaks make them stronger, and a decisive break often signals a shift in momentum.
- Support & Resistance: Support acts as a floor where buying interest tends to emerge, while resistance works as a ceiling where selling pressure increases. They are usually zones rather than precise points and are widely used to plan entries, exits, and stop-loss placements.
- Pivot Points: Calculated from the prior session’s high, low, and close, pivot points project likely intraday or short-term turning areas. Price trading above the pivot often indicates bullish bias, while trading below suggests bearish sentiment.
- Core Technical Indicators
Technical indicators help traders measure momentum, trend strength, and potential reversal zones. Commonly used ones are:
- Moving Averages & Crossovers (e.g., golden/death cross)
Moving averages smooth out price fluctuations to reveal the broader trend. A “golden cross,” where a short-term average (e.g., 50-day) moves above a long-term average (e.g., 200-day), is seen as bullish. A “death cross” is the opposite, signalling potential weakness.
- RSI, MACD, Stochastic Oscillator, Bollinger Bands, Fibonacci Retracements
Momentum and volatility indicators provide further insight into price behaviour. Core options include:
- RSI (Relative Strength Index): RSI ranges from 0 to 100, with readings above 70 suggesting overbought conditions and below 30 oversold. It helps spot potential reversals or pullbacks.
- MACD (Moving Average Convergence Divergence): MACD tracks the difference between two moving averages, with crossovers and histogram shifts indicating changes in momentum or trend direction.
- Stochastic oscillator: Stochastic oscillator compares the closing price to the recent trading range, often used to spot short-term overbought or oversold signals, especially in sideways markets.
- Bollinger bands: Bollinger brands plotted two standard deviations above and below a moving average, bands expand during high volatility and contract in calm markets. Touches at the outer bands often precede price reactions.
- Fibonacci retracements: A tool for mapping potential support and resistance during pullbacks, often used in combination with trendlines or candlestick signals for confirmation.
- Multi-Timeframe Analysis
When trading, looking at multiple timeframes (e.g. weekly + daily + intraday) helps confirm whether a signal is significant. A pattern on a daily chart means more if the weekly also supports the move. Signals on shorter timeframes can flicker or false break more often if they conflict with higher-timeframe trends.
- Technical Peer Comparison
With peer comparison, you evaluate a stock’s technical behaviour relative to its sector or similar stocks to spot relative strength or weakness. For example, a 2022 Indian equity study covering 14 large-cap Nifty-50 stocks found that a combined strategy of Bollinger Bands + RSI generated net profits in 11 of the 14 and outperformed buy-and-hold in 10 of them.
This kind of comparison helps confirm signals (e.g. breakouts or momentum) and avoid being misled by isolated setups when the broader peer group is weak.
- Entry & Exit Signals & Strategy
Timing is a key part of learning how to choose penny stocks effectively. Technical analysis provides structured signals to help identify entry and exit points with more discipline.
- Breakouts & Alternative Buy Points
Certain chart setups can act as practical guides for deciding when to buy penny stocks.
- Breakouts: When a stock price crosses above a strong resistance level with higher-than-average volume, it suggests fresh buying interest.
- Three-weeks tight: stock that trades within a narrow price range for three straight weeks often signals accumulation, making it a safer entry point.
- Shelf pattern: After an upward move, some stocks consolidate sideways, forming a “shelf.” A breakout from this pattern may signal the next leg of growth.
- Pullbacks: Small declines after a rally, especially on low volume, can serve as secondary buying opportunities instead of chasing peaks.
- Risk Management via Technical Analysis
Even penny stock strategies are incomplete without a strong risk framework. Technical tools provide simple ways to manage downside and maintain balance, including:
- Stop-loss, position sizing, confirming with volume
Effective risk control in penny stocks often comes down to three key practices:
- Stop-loss: Stop-loss levels act as safety nets by setting a predefined exit point if a stock falls below a certain price. This ensures that a small setback doesn’t turn into a large, unrecoverable loss. In highly volatile penny stocks, a stop-loss is often the first line of protection.
- Position sizing: Position sizing helps decide how much capital to allocate to each trade. By limiting exposure to, say, investing only a small fraction of one’s portfolio in a single penny stock investors can balance potential gains while keeping overall portfolio risk under control.
- Confirming with volume: Volume acts as a validation tool. A price move supported by strong, consistent trading volume carries more weight than one based on thin trades. Confirmation through volume reduces the chances of acting on false signals or short-lived spikes.
- Use Stoxo AI for Technical Screening
To see how AI makes technical analysis simple, let’s check how Stoxo AI by StockGro works:
- Open Stoxo: Go to StockGro’s AI research engine.
- Type your query: Type in query such as “Analyze Tata Motors using technical analysis. Show candlestick trends, RSI and MACD, check daily and weekly charts, and highlight support/resistance with entry and exit points.”
- Get insights: Stoxo quickly creates a structured report.
It first shows the core numbers such as as shown in the image below:
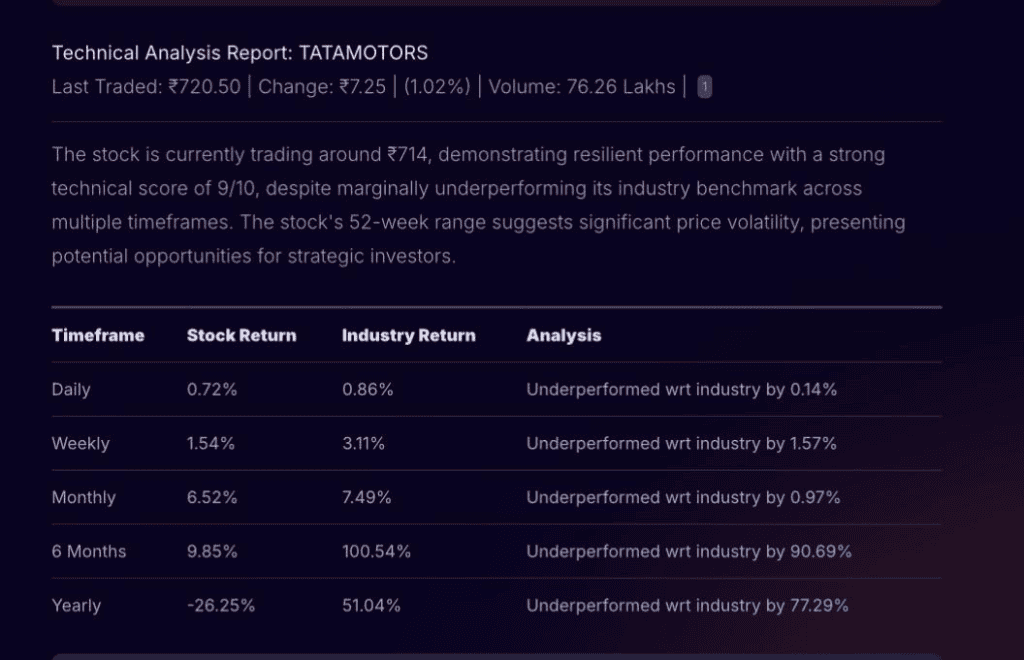
Then it breaks down the analysis:
- Trend & patterns: Stock has bounced from its 52-week low and is in a strong uptrend with higher highs and lows.
- Support & resistance: Support at ₹713.2 (Pivot) and ₹706.7 (S1); resistance at ₹721.4 (R1) and ₹727.9 (R2). A breakout above ₹736.1 (R3) could push it higher.
- Momentum: Even without exact RSI/MACD, the price action and big volume show strong buying interest.
- Multi-timeframe check: Both daily and weekly charts confirm the uptrend, with ₹700 acting as a solid base.
- Trading plan: Entry near ₹713–₹721, stop-loss below ₹698.5 (S2), targets at ₹727.9 and ₹736.1.
- Sector view: Auto-ancillaries sector is strong, supporting Tata Motors’ momentum.
In short, Stoxo pulls everything, patterns, support/resistance, volume, and timeframes into one clear view, making technical analysis faster and more efficient.
- Why Technical Analysis Matters
Technical analysis helps traders and investors make sense of price movements and market psychology, providing clarity where fundamentals alone may fall short:
- Predicts trends and market direction: Technical analysis enables traders to spot the onset and continuation of trends through patterns and signals, especially valuable when fundamental data is limited or unreliable in penny stocks.
- Detects suspicious or manipulated moves: Technical indicators can flag unusual price and volume spikes, helping traders recognize potential market manipulation before fundamentals reflect it. For example, the rapid, pattern-driven rally in Gita Renewable Energy, showed price action racing ahead while fundamentals lagged behind.
- Enables rule-based, disciplined trading: A key strength of technical analysis is removing emotion by relying on predefined entries, exits, and stop-losses. Traders follow structured signals from price patterns, support/resistance, and momentum indicators. For example, as of July 2025 showed that over the previous one-year period, seven penny stocks by price, market cap, and volume gained 50%–700%, showing the power of structured strategies.
- Exposing pump-and-dump signals: Technical analysis helps identify unusual price surges that lack steady volume support. Sudden spikes without matching trading activity often point to artificial promotion, allowing investors to spot and avoid potential pump-and-dump setups early.
Conclusion
Learning how to do technical analysis of stocks is about more than reading charts, it’s about applying discipline, spotting trends early, and managing risk effectively. By combining price action, indicators, and multi-timeframe strategies, investors can sharpen timing and make smarter decisions. In markets where the right stock can still fall at the wrong time, technical analysis provides the clarity and edge needed to trade with confidence.
FAQs
The 7% rule advises selling a stock if it falls 7% or more below your purchase price. This stop-loss strategy helps limit losses, protect capital, and avoid emotional decision-making. It’s based on studies showing healthy stocks rarely drop more than 7-8% from a proper buy point.
Technical analysis involves studying price charts, volume, and indicators like moving averages, Relative Strength Index (RSI), MACD, and candlestick patterns. It helps identify trends, support/resistance levels, and momentum, providing insights into future price movements to guide buy or sell decisions.
The best time frame depends on your trading style. Intraday traders focus on minutes to hourly charts, swing traders use daily or weekly charts, and long-term investors look at weekly or monthly charts to gauge overall market trends and avoid noise.
The best tool for stock analysis depends on your approach. Fundamental investors often use screener platforms for financial data, while technical traders rely on charting tools with indicators like RSI or MACD. Increasingly, AI-based tools such as Stoxo simplify this by combining charts, indicators, and insights into one analysis.
Evaluate financial health via consistent revenue and profit growth, stable or improving ROE, low debt-to-equity ratios, positive free cash flow, and strong margins. Also consider management quality, competitive moat, and sector strength to confirm long-term sustainability.

Leave a Comment