What is the stochastic oscillator?
The Stochastic Oscillator is a momentum indicator used in technical analysis to measure the position of a stock’s closing price relative to its price range over a specific period. Developed by George Lane, it helps traders identify overbought and oversold conditions, as well as potential trend reversals.
The indicator moves between 0 and 100, where readings above 80 typically indicate overbought conditions and readings below 20 suggest oversold conditions. However, these levels do not always mean an immediate reversal; instead, they highlight zones where price momentum may weaken.
The Stochastic Oscillator is widely used by traders across different markets because it provides early signals and works well in range-bound conditions. It is also often compared or combined with tools like the stochastic RSI indicator for more refined signals.
How does the stochastic oscillator work?
The instrument calculates momentum by comparing an asset’s current near to its range across a predetermined number of days—5, 10, 14, 21, etc.—often 14 days. As noted earlier, it highlights the speed of price shifts rather than the direction itself.
- Range analysis : It calculates where the most recent close stands relative to the highest and lowest points during the selected period, giving insights into potential market extremes.
- Two lines at play
- %K line: Reflects the oscillator’s current reading.
- %D line: It is a moving average of %K (commonly 3 days), used to smooth out fluctuations.
A crossover between %K and %D, particularly in extreme zones, often signals a potential shift in market momentum.
- Both lines fluctuate between 0-100 : This indicator works best when combined with other techniques like trendlines or moving averages. Together, these tools can help traders time their entries and exits more effectively.
How the Stochastic Oscillator Identifies Market Trends
The Stochastic Oscillator helps identify whether momentum supports the current trend. In strong uptrends, the indicator tends to stay in the overbought zone for extended periods, while in downtrends, it remains in the oversold zone.
Rather than focusing only on overbought or oversold levels, traders often look at trend alignment. For example, in an uptrend, pullbacks to oversold levels may present buying opportunities.
This makes the oscillator useful not just for reversals but also for identifying continuation signals within trends.
What Does the Stochastic Oscillator Indicate?
The Stochastic Oscillator measures the momentum of price movement. It shows the relationship between the current closing price and the price range over a specific time period. It’s typically used to identify:
- Overbought conditions (above 80) and
- Oversold conditions (below 20).
These signals help traders anticipate trend reversals or the continuation of a trend.
How Do You Read the Stochastic Oscillator?
The Stochastic Oscillator is plotted as two lines:
- %K line: The main line showing the oscillator’s current value.
- %D line: A moving average of the %K line, typically a 3-period SMA.
- Above 80: Overbought → possible reversal or pullback.
- Below 20: Oversold → possible reversal to the upside.
- Crossovers: A crossover of the %K line above the %D line is bullish; below is bearish.
How to Use the Stochastic Oscillator
Step 1: Add the indicator to your chart
Open your trading platform and apply the Stochastic Oscillator to the stock or index chart. Most traders use the default 14-period setting. You can adjust the timeframe based on whether you are trading intraday, swing, or positional setups.
Step 2: Identify overbought and oversold zones
The indicator moves between 0 and 100. A reading above 80 usually indicates an overbought zone, while a reading below 20 indicates an oversold zone. These levels help traders identify possible reversal areas.
Step 3: Watch the %K and %D lines
The %K line is the faster line, while the %D line is the slower signal line. When %K crosses above %D, it may indicate bullish momentum. When %K crosses below %D, it may indicate bearish momentum.
Step 4: Confirm with price action
Do not trade only based on stochastic signals. Check support, resistance, trendlines, or candlestick patterns before entering a trade. Confirmation reduces false signals.
Step 5: Use it according to market condition
In sideways markets, traders often buy near oversold levels and sell near overbought levels. In trending markets, use the oscillator to identify pullbacks rather than immediate reversals.
Step 6: Look for divergence
Bullish divergence occurs when price makes a lower low, but the Stochastic Oscillator makes a higher low. Bearish divergence occurs when price makes a higher high, but the indicator makes a lower high. These signals can warn of possible trend reversals.
Step 7: Set entry, stop-loss, and exit levels
Enter only after confirmation from price movement. Place stop-loss below support for buy trades and above resistance for sell trades. Exit when the indicator reaches the opposite zone or when price shows weakness.
Stochastic Indicator Buy and Sell Signals
Buy Signal
A bullish or buy signal is generated when the Stochastic Oscillator moves into the oversold zone below 20 and then starts turning upward. This suggests that selling momentum may be weakening and buyers could begin taking control.
The most common confirmation comes when the %K line crosses above the %D line inside or near the oversold region. This crossover indicates a potential shift in momentum from bearish to bullish.
However, traders should avoid entering solely based on the crossover. A stronger setup occurs when the stock price also shows:
- Support near an important price zone
- Bullish candlestick confirmation
- Increase in trading volume
- Trend reversal signs
Example of a Buy Signal:
- Stochastic falls below 20
- %K crosses above %D
- Price forms a hammer candlestick near support
- Volume increases
This combination strengthens the probability of a bullish reversal.
Sell Signal
A bearish or sell signal is generated when the indicator moves into the overbought zone above 80 and begins turning downward. This suggests that buying momentum may be slowing and sellers could start gaining control.
The sell signal becomes stronger when the %K line crosses below the %D line in the overbought region. This crossover indicates a possible momentum reversal from bullish to bearish.
For higher reliability, traders should also look for:
- Resistance near a key price level
- Bearish candlestick patterns
- Weakening price momentum
- Declining volume during upward moves
Example of a Sell Signal:
- Stochastic rises above 80
- %K crosses below %D
- Price faces resistance near previous highs
- Bearish engulfing pattern appears
This increases the probability of a short-term correction or trend reversal.
How To Trade With Stochastic Oscillator
- Overbought/Oversold Levels: Buy when the oscillator is below 20 (oversold) and turns upwards; sell when it’s above 80 (overbought) and turns downwards.
- Crossovers: Watch for the %K line crossing above the %D line for buy signals and below for sell signals.
- Divergence: Look for divergence between price and the oscillator—if price makes a new high while the oscillator doesn’t, it could indicate a potential reversal.
Stochastic Oscillator Formula
The formula for the Stochastic Oscillator is:
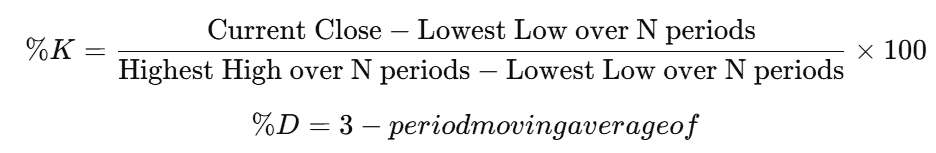
Where:
- N is the number of periods (usually 14).
- Lowest Low is the lowest price over the period.
- Highest High is the highest price over the period.
How to Calculate the Stochastic Oscillator
- Select the period (usually 14) for which you’ll calculate the highest high and the lowest low.
- Find the current close price of the asset.
- Calculate %K using the formula by comparing the current close with the range between the highest high and the lowest low over the selected period.
- Smooth %K with a 3-period simple moving average to get %D.
Example of Stochastic Oscillator
Let’s assume:
- 14-period highest high = ₹150
- 14-period lowest low = ₹120
- Current closing price = ₹135
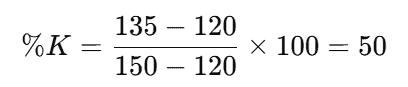
If you calculate the 3-period SMA of %K, you get the %D line. The crossover of %K and %D gives buy/sell signals.
Stochastic Oscillator vs RSI
| Basis | Stochastic Oscillator | RSI (Relative Strength Index) |
| Type | Momentum indicator | Momentum oscillator |
| Calculation | Compares closing price to price range | Measures strength of price movements |
| Range | 0 to 100 | 0 to 100 |
| Overbought Level | Above 80 | Above 70 |
| Oversold Level | Below 20 | Below 30 |
| Sensitivity | More sensitive, frequent signals | Smoother, fewer signals |
| Best Use | Range-bound markets | Trending and momentum markets |
| Signal Type | Crossovers and divergence | Divergence and threshold levels |
| Noise Level | Higher (more signals) | Lower (less noise) |
Uses of the Stochastic Oscillator
- Trend Reversal Identification: Recognize when an asset is potentially overbought or oversold, signaling a potential trend reversal.
- Momentum Indicator: Measures the strength of a trend. When the oscillator stays above 80 or below 20, it shows strong momentum.
- Divergence: Helps identify divergences between price and oscillator to spot potential trend changes.
- Buy/Sell Signals: Used in combination with other indicators, it helps to pinpoint entry and exit points for trades.
Stochastic oscillator indicator formula
The tool relies on two formulas, each serving a different purpose in tracking momentum. Here we are assuming the most commonly use 14 days period for %K and 3 days average for %D
- %K line formula:
%K = 100 x (CP – L14) / (H14 – L14)
Where:
- CP: The most recent closing price.
- L14: The lowest price over the last 14 trading sessions.
- H14: The highest price during the same 14-day period.
This calculation shows how close the latest closing price is to the asset’s 14-day range. It highlights shifts in momentum that might otherwise be overlooked.
- %D line formula:
The %D is a 3-day simple moving average or SMA of the %K.
Both lines are plotted together, allowing traders to spot crossovers and other key signals. While modern trading platforms calculate these automatically, understanding the formulas helps decode the deeper story behind price movements.
Stochastic Oscillator vs RSI
| Basis | Stochastic Oscillator | RSI (Relative Strength Index) |
| Type | Momentum indicator | Momentum oscillator |
| Calculation | Compares closing price to price range | Measures strength of price movements |
| Range | 0 to 100 | 0 to 100 |
| Overbought Level | Above 80 | Above 70 |
| Oversold Level | Below 20 | Below 30 |
| Sensitivity | More sensitive, frequent signals | Smoother, fewer signals |
| Best Use | Range-bound markets | Trending and momentum markets |
| Signal Type | Crossovers and divergence | Divergence and threshold levels |
| Noise Level | Higher (more signals) | Lower (less noise) |
Uses of the Stochastic Oscillator
Identify Overbought and Oversold Levels:
The Stochastic Oscillator helps traders identify overbought and oversold zones. This improves entry and exit timing, especially in range-bound markets.
Useful in Sideways Markets:
The indicator performs well when prices move within a fixed range. Traders use it to buy near support and sell near resistance.
Detect Divergence:
It helps identify bullish and bearish divergence. Divergence occurs when price makes a new high or low, but the indicator fails to confirm the move.
Spot Potential Trend Reversals:
Divergence and crossover signals can indicate possible reversals before they happen. This gives traders an early warning of momentum shifts.
Identify Momentum Changes:
The indicator measures momentum strength and weakness. Rising stochastic values indicate strengthening momentum, while falling values suggest weakening momentum.
Generate Buy and Sell Signals:
Crossovers between the %K and %D lines are commonly used as trading signals. A bullish crossover may indicate buying opportunity, while a bearish crossover can signal selling pressure.
Improve Trade Timing:
The Stochastic Oscillator helps traders refine entries during pullbacks or reversals. This improves overall risk-reward ratio in trades.
Limitations of the stochastic oscillator
- Unreliable in volatile conditions : In rapidly changing environments, the stochastic can suggest entries or exits too early, leading to poor decisions. Sudden price fluctuations often result in inaccurate signals.
- Misleading divergence : When price and the indicator diverge, it doesn’t always mean a change is imminent. Following divergence without further confirmation can lead to misguided actions and unexpected results.
- Struggles in strong trends : While useful for measuring momentum, the oscillator often stays in overbought or oversold zones during sustained trends. This can cause traders to miss extended moves or react too soon, assuming a reversal is near.
- Tightening limits may cause missed trades: Using more conservative boundaries, like 85 for overbought and 15 for oversold, reduces false readings but may cause traders to overlook key opportunities that don’t meet these stricter thresholds.
- Requires additional confirmation : Relying solely on this tool can be risky. Using it alongside other indicators, such as moving averages, offers a better perspective and helps filter out misleading signals.
Bottomline
The stochastic oscillator indicator is a useful tool for tracking market dynamics and identifying potential shifts in price direction. Its adaptability across various timeframes makes it popular, but it can occasionally mislead, particularly in fast-moving markets or prolonged trends.
To reduce the chances of acting on incorrect information, traders should use it in combination with other techniques. By doing so, one can better face the limitations and enhance decision-making for more reliable outcomes.
FAQs
Yes, the stochastic oscillator is considered a leading indicator because it can signal potential reversals before they occur. However, it may also produce false signals.
Yes, beginners can use it as it is relatively simple to understand. However, they should combine it with other indicators for better accuracy.
It can be used in trending markets, but signals may be less reliable. Traders often use it to identify pullbacks rather than reversals in strong trends.
Yes, it is commonly used with indicators like RSI, MACD, and moving averages. Combining tools improves signal accuracy and reduces false trades.