
Investing is not just about charts, but also about analysing fundamentals and market sentiment. A comprehensive stock market analysis enables investors to identify opportunities while remaining aware of potential risks.
This blog provides a guide for the stock market analysis types and how they help in making correct investment decisions.
What is Stock Market Analysis and why it Matters
Stock market analysis is the process of evaluating a stock or the stock market to evaluate price moves for making data-based investment decisions and managing risks to achieve financial goals.
Why does stock market analysis matter?
- Data-based Decisions: It helps investors to make informed investment decisions by providing different methods of analysis and indicators of the stock or the market.
- Identifying Opportunities and Risks: It helps to identify opportunities and risks involved with a stock, and allows proper diversification of the portfolio to prevent loss from a single investment.
- Boost Confidence: It provides an understanding of the stock market and the market participants, and how they behave, which boosts confidence in the investors.
Types of Analysis in Stock Market
Stock market analysis includes fundamental analysis, technical analysis, and sentiment analysis. Let’s discuss them in detail!
Fundamental Analysis
Fundamental analysis helps in understanding a stock’s intrinsic value. It involves analysing the company, its industry, and the economy, which helps investors to make long-term investment decisions and manage risks effectively.
Key Metrics: P/E, ROE, Debt Ratios, Earnings
Price-to-earnings (P/E) Ratio: It is a financial ratio, which is used for valuation, that compares the current price of a company’s stock with its earnings per share (EPS).
Price-to earnings (P/E) ratio = Share Price/ EPS
Return on Equity (ROE): It is a metric to evaluate the financial performance of a company by comparing its returns or net income to shareholders’ funds.
Return on Equity (ROE) = Net Income or Profit/ Shareholders’ Funds
Debt Ratio: Debt ratio or Debt-to-Equity ratio measures a company’s reliance on its debts in comparison to its equity or shareholders’ funds.
Debt-to-Equity Ratio = Total Debts/ Shareholders’ Funds
Earnings: Earnings can be defined as a company’s income or profit, or a measure of profitability.
Profits = Total Revenue – Indirect Expenses
Or
Profit after tax (PAT) = EBITDA – (Interest + Tax + Depreciation + Amortisation)
Where, EBITDA = Earnings before interest, taxes, depreciation, and amortisation
Industry & Economic Analysis
Industry analysis in fundamental analysis helps investors identify industry-specific drivers and trends.
- Competitive Forces: By using models such as Porter’s 5 Forces, investors can understand the competition level, drivers, and players of a particular sector or industry.
- Industry Overview: It provides insights into whether an industry is growing or declining, or is in which stage of the industry life cycle.
- Regulatory Activities: Industry analysis also helps investors to understand the regulatory environment of an industry, which affects its performance.
Economic analysis in fundamental analysis provides a deeper understanding of economic indicators that affect the stock and the economy.
- Gross Domestic Product (GDP): It reflects the growth rate and performance of an economy, which helps investors to manage their portfolio effectively.
- Interest Rates: They impact the borrowing power of companies, which could affect operations and financial performance.
- Inflation: It affects cost structure, profit margins, and the purchasing power of consumers. For example, it reflects whether the growth of the company is real or it is because of inflation.
Use Case: Long-Term Investment Decisions
Investors can perform fundamental analysis using AI for scanning financial reports, calculating ratios, and comparing industry benchmarks, which will enable them to focus on strategy instead of manual calculations.
Here’s an example of how Stoxo conducted a fundamental analysis on TCS:
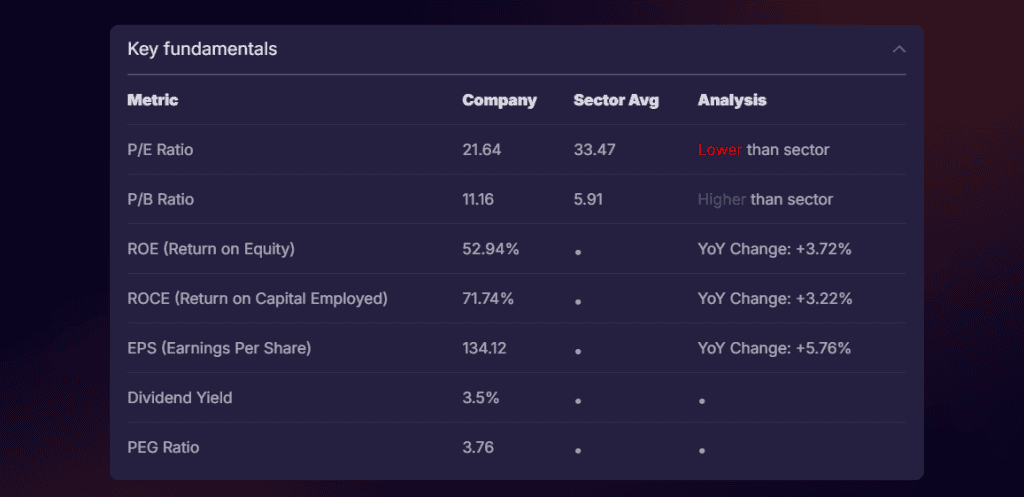
This represented the key fundamental metrics of the company, along with its analysis in comparison to the sector.
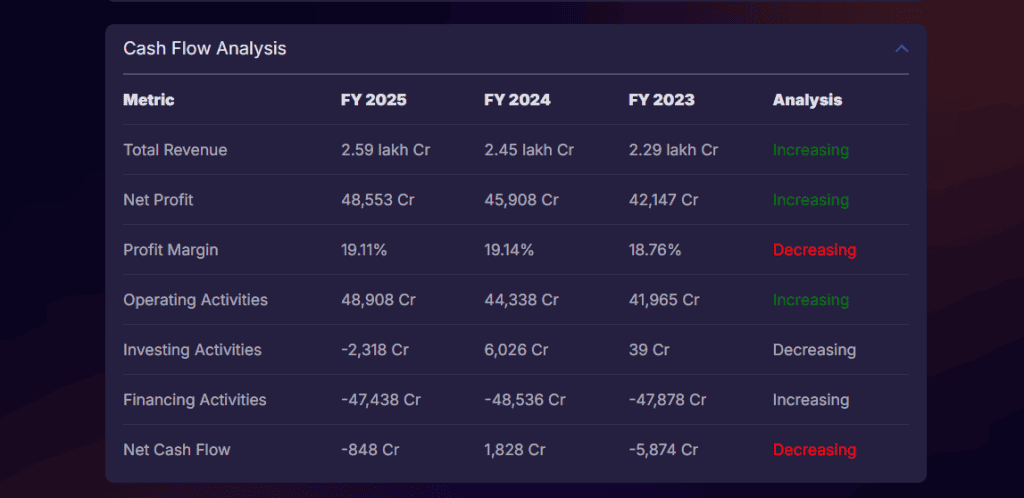
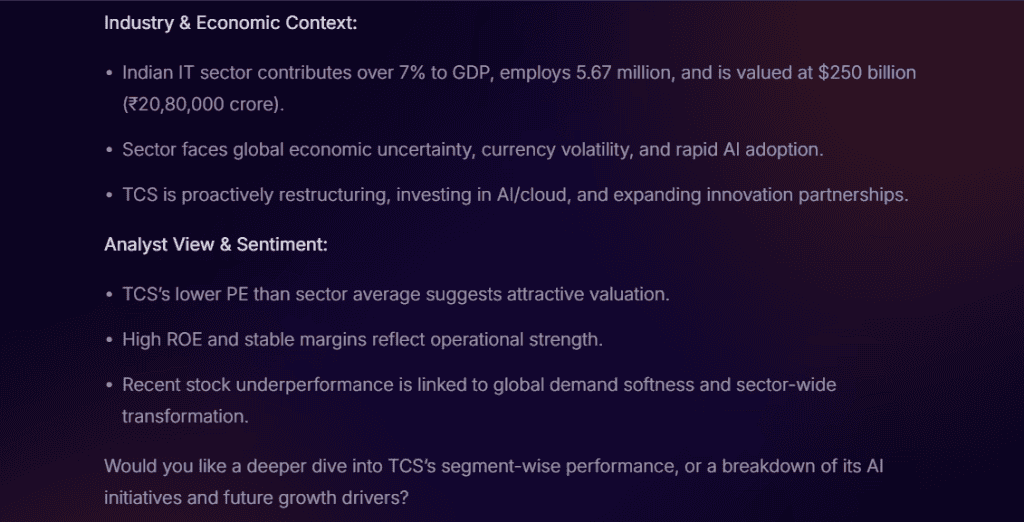
Here are some snapshots of the cash flow analysis and industry and economic analysis of TCS, an important measure of financial stability and the company’s ability to sustain operations and expand.
Technical Analysis
Technical analysis is a method of analysing a stock by evaluating its market performance using charts, technical tools, and platforms, as well as past prices and volume.
Charts & Price Patterns
Technical analysis is based on charts, for example, line charts, candlestick, etc., which reflect price movements over specific time periods and provide visualisation of market movements.
Price patterns are understandable forms and shapes that appear on the technical charts, with a series of trendlines or curves that connect price points over a period of time. For example, patterns like head and shoulders, double tops, etc indicate reversal of current price trend.
Indicators & Tools: RSI, Moving Averages, Bollinger Bands
Relative Strength Index (RSI): It is a measure of speed and change in price rates of a stock, usually swings between 0-100, which indicates the velocity of price movements. It helps investors to understand high trade volume and potential reversals.
Relative Strength Index (RSI) = 100 – {100/(1 + RS)}
And, Relative Strength (RS) = Average Gain/ Average Loss
Moving Average: It is an indicator that follows trends, which makes trends easy to spot by smoothing the data of price movements. It mainly helps with trend identification and confirmation.
Bollinger Bands: It is an indicator that is a set of bands that comprises 20 periods of simple moving averages (SMA), with upper bands and lower bands. It provides an overview of price volatility.
Volume & Trend Analysis
Volume analysis measures the total buy and sell orders of a stock in a particular period of time, which indicates market strength, trends and liquidity.
Trend analysis uses historical data and statistics to identify trends and patterns and forecast outcomes, which helps investors to make timely decisions.
Use Case: Short-Term Trading Decisions
Traders can use a combination of tools, each for a specific purpose, which are indicators such as RSI or moving average, and volume analysis.
Technical analysis using AI can track price movements, identify patterns, and use indicators, which enables investors to focus on decision-making rather than studying charts manually.
An example of technical analysis of TCS stocks, using Stoxo:
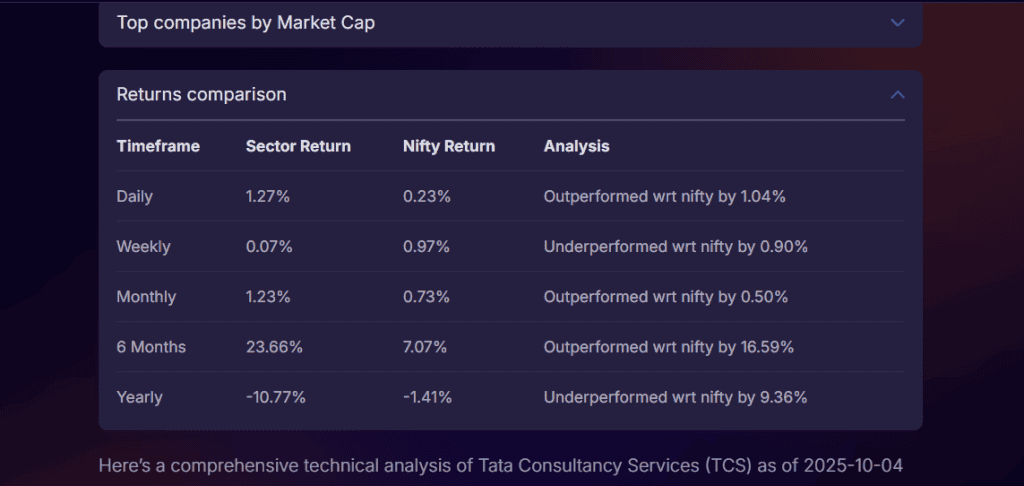
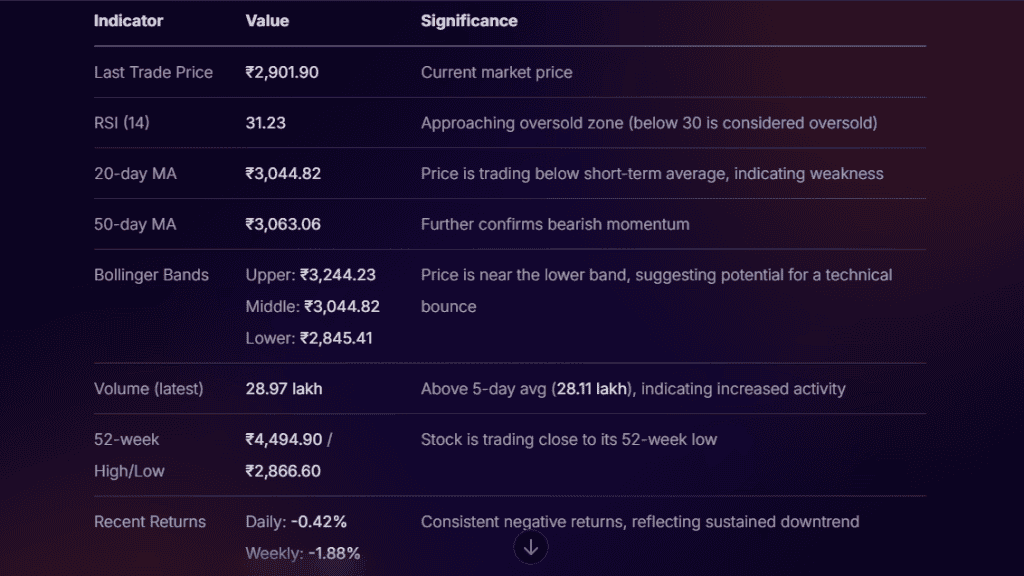
These are some snapshots from the analysis conducted by Stoxo for TCS, which compares returns over different time periods, using technical indicators that show RSI, Bollinger bands, volume, and much more.
Sentiment Analysis
Stock market analysis is more than fundamental analysis vs technical analysis. There is also Sentiment analysis, which studies the psychology of the market.
Sentiment analysis in stock markets is a method to measure the mood or attitude of market participants, by using technical tools, for a stock and forecast its price moves to make efficient decisions.
News, Social Media & Analyst Reports
The data for sentiment analysis can be collected from various sources, such as:
- News: Investors can analyse news articles or magazines that post information about the companies regarding earnings, products, effects of policies for different industries, etc.
- Social Media: Investors can monitor various platforms, such as Twitter or X, for investors’ opinions and attitudes towards a particular company.
- Analyst Reports: Investors should stay updated with the latest reports published by the company, as well as new government policies that could impact particular companies or a sector..
Tools & Models (Stoxo, FinBERT, NLP Libraries)
Stoxo: Stoxo is a stock market AI, by Stockgro, designed for Indian retail investors. It combines AI with insights from SEBI-registered analysts and Stockgro users, which provides signal-based inputs for investment-related questions.
FinBERT: FinBERT is a specialised financial sentiment analysis Natural Language Processing (NLP) model following Bidirectional Encoder Representations from Transformations (BERT). It is trained with a large set of financial data, which can accurately specify sentiment from financial-related text.
Natural Language Processing (NLP) Libraries: NLP libraries for sentiment analysis are Natural Language ToolKit (NLTK) for beginners, TextBlob for simple and user-friendly sentiment analysis, spaCy for speed and efficiency, etc.
Integrating the Three Types of Analysis
Let’s understand how integrating fundamental, technical, and sentiment analysis could provide a balanced approach to stock market analysis.
- Macro Level analysis with Fundamental analysis: Fundamental analysis evaluates economic indicators, industries, and the financial performance of companies. It helps investors to select based on its company’s performance, with actual growth prospects.
- Micro Level analysis with Technical analysis: Technical analysis helps to identify price action, which helps investors to identify support and resistance levels, and plan entry and exit strategies.
- Real-time market analysis with Sentiment Analysis: Investors can monitor the sentiments of market participants to effectively manage risk. For example, random walk theory says any positive or negative news regarding a company can affect its stock price.
Step-By-Step Guide to Analyse Stocks
Here are some key steps on how to analyse stocks:
Step 1: Conduct fundamental analysis: The first step is to understand what to buy. It evaluates the intrinsic value of a company and its underlying financial position, which will help to understand its long-term performance.
- Analyse its financial performance by evaluating its annual reports, key financial ratios including ROE, Debt-to-Equity ratio, P/E ratio, etc.
- Analyse the economy and industry to understand the economic condition and competitive environment.
Step 2: Conduct technical analysis: Technical analysis helps in identifying and planning entry and exit of a trade. It helps to analyse historical prices and trade volume, which identify price patterns, support, and resistance.
- Analyse charts and observe patterns that could indicate reversals or breakouts.
- Using indicators such as moving averages, RSI, etc., will show movements, volatility, and trends.
Step 3: Conduct sentiment analysis: Sentiment analysis tells why certain investment decisions are to be made. It analyses prevailing sentiments of investors in the market regarding a stock.
- Analyse new articles and social media posts to observe the mood board of the participants regarding the company or industry.
- Measure the emotions of the market participants with the help of technical tools such as Market Mood indices or volatility indices (VIX), which can quantify market interests.
Investors can use stock market AI to combine these three analyses together by evaluating financials, identifying patterns, and monitoring sentiment, while helping investors save time and improve strategy and decision-making.
Conclusion
Stock market analysis helps investors to make data-based decisions by identifying opportunities and risks while boosting their confidence. By combining fundamental analysis for intrinsic value, technical analysis for price patterns and trends, and sentiment analysis for market mood, investors can manage risks, diversify their portfolios effectively.
FAQs
The types of stock market analysis are primarily fundamental analysis, technical analysis, and sentiment analysis.
Fundamental analysis is evaluating the intrinsic value of a stock by analysing a company, its industry, and the economy. It helps investors to make long-term investment decisions and manage risks effectively.
Technical analysis helps traders and investors by using historical price and volume to identify trends, forecast price movements, and plan entry and exit points for a trade.
Sentiment analysis is a method of understanding the psychology of market participants, based on news, social media, and analyst reports, as well as by using technical tools, to analyse price moves and make efficient decisions.
Investors can combine fundamental, technical, and sentiment analysis to build an effective strategy by integrating intrinsic value, price action, and market psychology for a complete stock overview.
Fundamental analysis is a beneficial approach for long-term investment decisions, while for short-term trading decisions, technical analysis is more effective.
Investors sometimes ignore fundamentals and focus only on short-term price moves.
Misinterpreting technical patterns without confirming trends.
Overlooking market sentiment and missing its impact on stock prices.

Leave a Comment