Did you know that the financial market has sentiments like all of us? Sometimes, the market is happy and on the rise. Some other times, it is gloomy and feeling low. And, sometimes, it is not either.
Well, what do we mean by the market feeling happy or gloomy? Let us figure it out through the article, where we discuss market sentiments, its analysis, and why it is essential for investors.
You may also like: Your ultimate guide to investing in a bear market
What is market sentiment?
What is your take on the market today? Do you think it is up-trending or down-trending? Well, that is your outlook. Similarly, every investor will have an outlook towards a specific security or the market in general and make investment decisions accordingly.
The collective outlook of all investors towards the market influences how the market behaves, and this refers to market sentiment.
So, when the majority of investors are optimistic about the market, the market starts moving upwards. The market sentiment, in this case, is bullish.
When most investors feel negative about the market, it starts moving downwards. The sentiment here is bearish.
When no feeling dominates among investors, the market moves sideways, creating an indecisive sentiment.
What is the fundamental purpose of sentiment analysis?
Investors and traders are considered rational beings who rely on facts to make judgements. Though there are contradictions to this opinion, like the concept of behavioural finance, market sentiment analysis is essential for all those involved in financial market transactions. It is all the more necessary for traders as they formulate their trading strategies based on the market’s direction. Market sentiments play a critical role in deciding the buying and selling points, especially in the case of day traders who buy and sell on the same day.
A bullish market is where prices are expected to rise further, and a bearish market is where prices will fall. Understanding the future directions is crucial to determining entry, exit and target points for traders.
Some traders prefer trading the trend, where they devise strategies in the same direction of market movement. So, they take long positions when the market is bullish and short positions when it is bearish.
Some other traders prefer trading against the trend. They formulate counter-trend strategies to move in the opposite direction of the trend.
In either case, analysing market trends, i.e., market sentiments, serves as the basis for planning strategies.
Also Read: Market cycles: Riding the rollercoaster of stocks
Market sentiment indicators
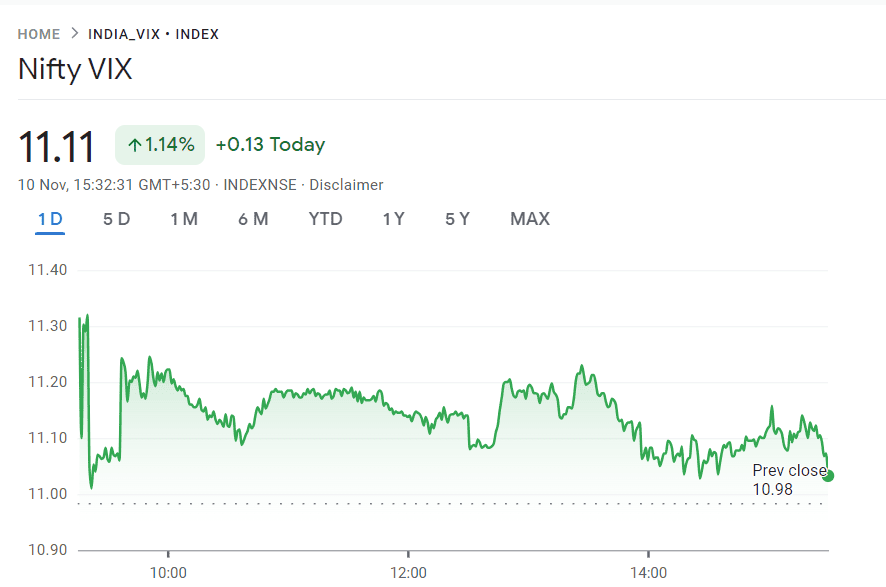
- The Volatility Index (VIX) – It is an indicator introduced by the CBOE (Chicago Board of Exchange) Global Markets, an options exchange in the United States of America. Also called the fear index, it predicts the volatility of prices for the next 30 days. The Indian adaptation of this index is called India VIX or NIFTY VIX, which is based on NIFTY. It suggests the volatility of NIFTY for the next 30 days.
Price volatility is an inherent risk of trading in the stock market. Assessing the level of volatility will help traders mitigate their risks better.
- The high-low index – It is an index applied in the U.S. stock markets, like the New York Stock Exchange, to assess the number of stocks hitting 52-week highs against the stocks hitting 52-week lows. While there is no counterpart to this index in India, the Indian stock exchanges publish the list of stocks hitting their 52-week highs and lows. Investors can use this information to assess how stocks and their related sectors are performing.
- Moving average indicators – It is an indicator used in the technical analysis of stocks which suggests the future direction of a stock’s price based on past data. It primarily uses different price points and the number of periods under consideration to ascertain the future movement of stocks.
ADX
The Average Directional Index (ADX) or the Directional Movement Index (DMI) is an example of a moving average indicator.
- Market Mood Index (MMI)- The Market Mood Index is an indicator developed by a U.S. research company. It considers factors like the economic environment, investor emotions, companies’ performance, etc., to derive an average number that determines the market sentiment.
The index value between 0 to 25 suggests extreme fear, 26 to 49 suggests fear, 50 suggests neutral, 51 to 75 suggests greed and 76 to 100 extreme greed.
The stock exchanges do not officially publish the market mood index in India. Some brokerage firms publish these numbers, however, it is more suitable to rely on official stock market indices.
Drawbacks of market sentiment analysis
While market sentiment analysis has benefits, there are also some setbacks if investors rely on this alone.
The concept of behavioural finance criticises the idea of investors being rational and relying on technical indicators that suggest market sentiments to make investment decisions. Sometimes, investors use their emotions to decide, which these indicators do not capture. So, these indicators may not represent the accurate market picture.
Also read: Your guidebook to Dow theory in technical analysis
It is ideal to use market sentiment indicators with individual stock indicators like ratios and charts, as some stocks may react aggressively and not follow the expected market trends.
Bottomline
As with every other indicator, market sentiment indicators have pros and cons, too. While they are definitely beneficial for traders to assess trends and plan strategies, they are not ideal when used in isolation.
Most of the technical indicators are prone to human error and misinterpretation. Hence, it is suggested to use them in combinations for accurate results.