
Introduction
One of the stepping stones in a trader’s decision-making process involves successful trend analysis. Investors, analysts, and traders make correct decisions and manage risk more effectively when they understand market movements using trend analysis. This guide explains basic trends and advanced technical indicators in clear terms for new and experienced traders alike.
What is Stock Market Trend Analysis?
Stock market trend analysis is a method of analysis used to identify trading or investing opportunities in markets based on current market actions. Unlike fundamental research, which focuses on firm profitability or management quality, technical trend analysis of stocks uses charts to directly address price activity and transaction volume. It’s less about understanding why the market is moving and more about recognising where it’s headed.
Trend analysis is about identifying trends based on historical price and volume data to predict where prices will move next. These visual patterns serve as indications for traders to react—either buy, sell, or hold back.
Core Principles: Trends, Momentum & Price Action
To understand how to analyse stock trends, first let’s understand the core principles involved in it:
Trends
The concept of a trend is the foundation for analysing stock prices. Contrary to moving randomly, prices often tend to move in a particular direction for a sustained duration- a principle based on the belief that “prices move in trends.” Trends are categorised as bullish, bearish, or in consolidation.
Momentum
Momentum reflects the pace at which an asset’s price changes. It shows whether the price is accelerating or decelerating within the trend. Momentum indicators like MACD or RSI help quantify this and gauge the potential continuation or reversal scenarios.
Price Action
Price action is the study of a stock price over time, which is plotted on a chart and used as the base for technical analysis. Traders who use price action focus on interpreting patterns and trends from price movements, often without relying on other indicators, to make trading decisions, like when to buy or sell. This method is widely used to evaluate market behavior by analysing past and present prices to predict future movement.
Types of Trends: Short, Medium, and Long-Term
There are usually three types of trends: short-term, medium-term, and long-term:
- Short-term: Short-term trends usually last from minutes to days. Day traders consider short-term trends.
- Medium-term: Medium-term trends can last from weeks to months and are considered by swing traders.
- Long-term: Long-term trends last for several months or even years.
Trend Lines, Channels & Support/Resistance Tools
Different trend tools help traders make that trading decision based on trends. Let’s have a look at some important trend analysis tools:
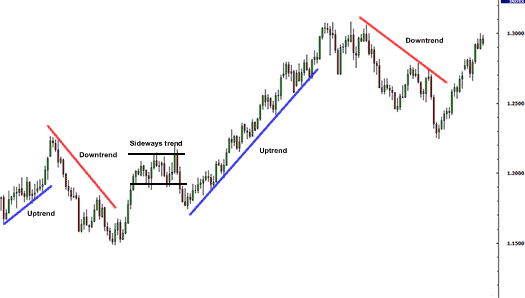
Trend Lines
Two or more price points connected on a chart with an unbroken straight line are a trend line. They show the stock market direction. Analysts use it to understand if a stock is in a bullish, bearish, or sideways phase.
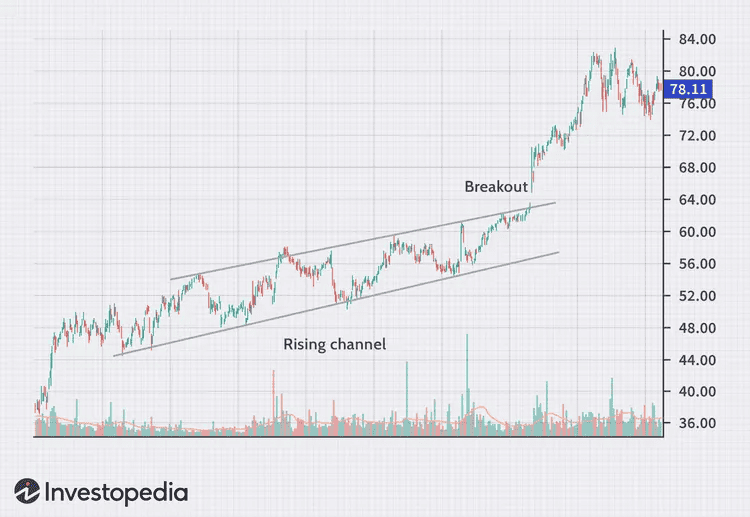
Channels
Two parallel lines, one above the price that indicates resistance and the other below the price that indicates support, form a channel. These lines assist traders in determining the ranges of prices where a stock is most likely to move or remain unchanged. Price movement between a channel’s top and lower bounds may indicate that a trend will continue or shift
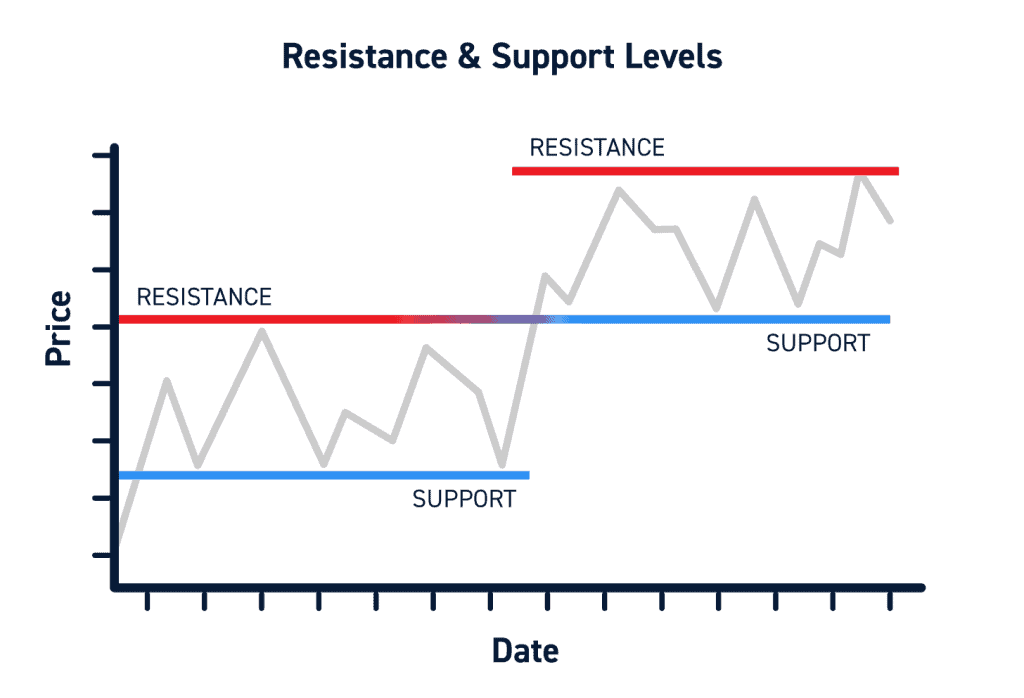
Support and Resistance
A support level is a price range where buying dominates and halts stock prices from falling any further. A resistance level is where selling pressure persists and acts as a ceiling for price movements. People often use horizontal lines to plot these tools at important recent highs and lows, or at points where the price has bounced or reversed many times in the past.
Key Indicators: MA, RSI, MACD, ADX, Aroon
RSI (Relative Strength Index) moves from 0 to 100, plotting recent price gains versus losses. RSI gauges momentum and trend strength. It shows if a stock is overbought (RSI above 70, stock could decline) or oversold (RSI below 30, stock could rally). This is the basic use of RSI.
MACD (Moving Average Convergence Divergence): MACD helps traders assess trend direction and momentum while providing analysts with signals. MACD above zero indicates an upward phase. Below-zero signals a bearish period.
ADX (Average Directional Index): The average directional index (ADX) is a useful indicator that assesses the intensity and accurate pace of a trend. In contrast to most indicators that indicate whether the price is rising or falling, ADX explicitly gauges the strength of the trend, independent of its direction.
Aroon: is used as a trend-spotting indicator, helping traders identify the beginning and ending of trends. This indicator focuses on time, measuring the total duration since the peak and lowest prices occurred within a given period.
Volume, Breadth & Volatility Indicators (OBV, ATR)
Volume: Volumes are used to confirm a trend. The end-of-day volumes indicate the accruing volume across all trades executed in the trading day. High trading volumes often indicate strong market participation and can signal the involvement of institutional or smart money, suggesting conviction behind a price move. Conversely, low volumes typically reflect limited interest or retail-dominated activity, where price movements may lack reliability. Traders usually avoid trading during low volume. For example, if 2,000 shares are bought and 2,000 shares are sold, the total trading volume is 2,000, not 4,000 – because each trade involves both a buyer and a seller, counted as one transaction.
On-Balance Volume (OBV): OBV employs volume to forecast future price movement by tracking buying and selling pressure. It’s a running total that increases by the trading volume on days when the stock closes higher than the previous session and decreases by the volume on days when the closing price is lower. OBV is used by analysts to gauge trend strength, validate price action, and identify possible trend reversals. For example, suppose a stock closes higher today than yesterday with a trading volume of 1,00,000 shares – this volume is added to the OBV total. If the next day the stock closes lower with a volume of 80,000 shares, that volume is subtracted from OBV. Over time, this cumulative figure helps analysts identify whether buying pressure (rising OBV) or selling pressure (falling OBV) is dominating.
Average True Range (ATR): Average True Range (ATR) is used to gauge market volatility by averaging the price range of a stock for 14 days. ATR does not anticipate price movement but indicates how much the stock price is fluctuating. An increase in ATR indicates rising volatility, while a decrease in ATR indicates falling volatility. ATR is used by traders to determine stop losses, determine position sizes, and prevent low-volatility stocks.
Chart Patterns: Triangles, Head & Shoulders, Flags
Chart patterns help traders anticipate potential trend continuation and trend reversal.
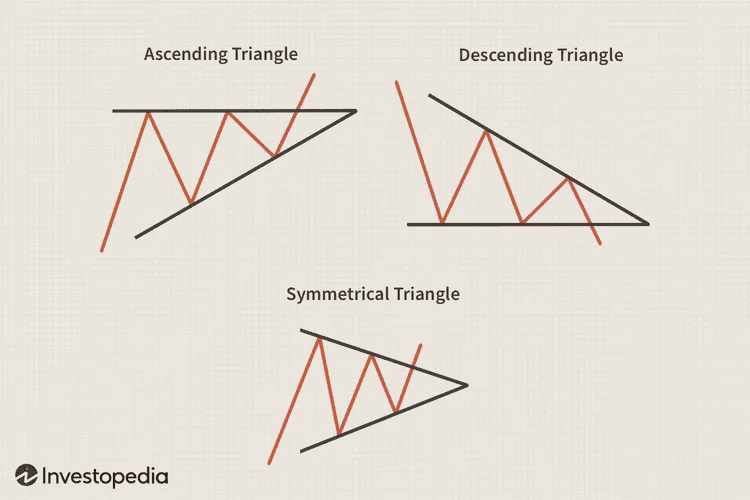
- Triangle chart pattern: The Triangle pattern is used by traders to understand if the trend will continue or a reversal will happen in the selected stock. This chart pattern is created by drawing trendlines at an intersecting price range. Triangles are similar to wedges and pennants and can be either a continuation pattern, if validated, or a powerful reversal pattern, in the event of its failure.
Three potential triangle variations are widely used by analysts, as stated below:
- Ascending
- Descending
- Symmetrical triangles.
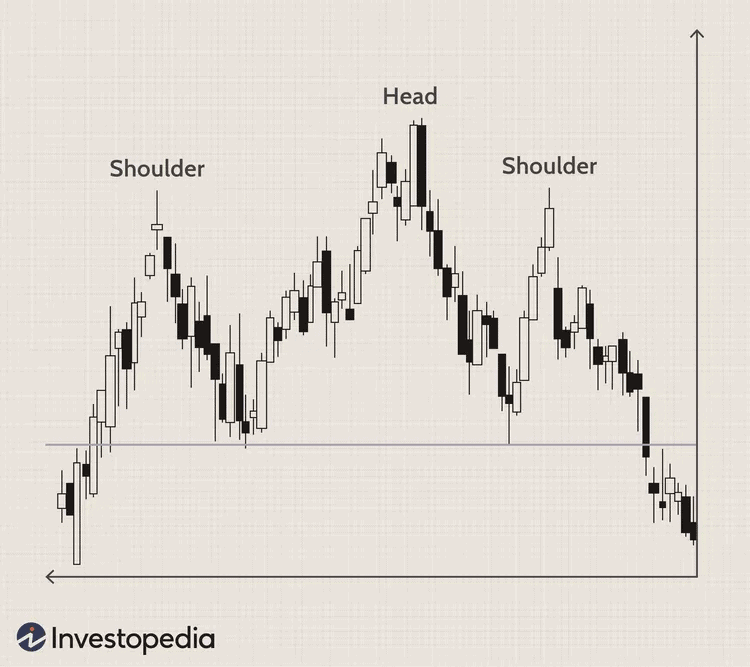
Head and Shoulders: The Head and Shoulders pattern is a pattern of technical analysis that assists analysts in identifying a potential change from a bullish to a bearish trend. It has three peaks: the left shoulder, the head (the highest peak), and the right shoulder. The neckline, formed by drawing a line connecting the lows between these peaks, acts as a major support level. If the price falls below this neckline, it verifies the trend change.
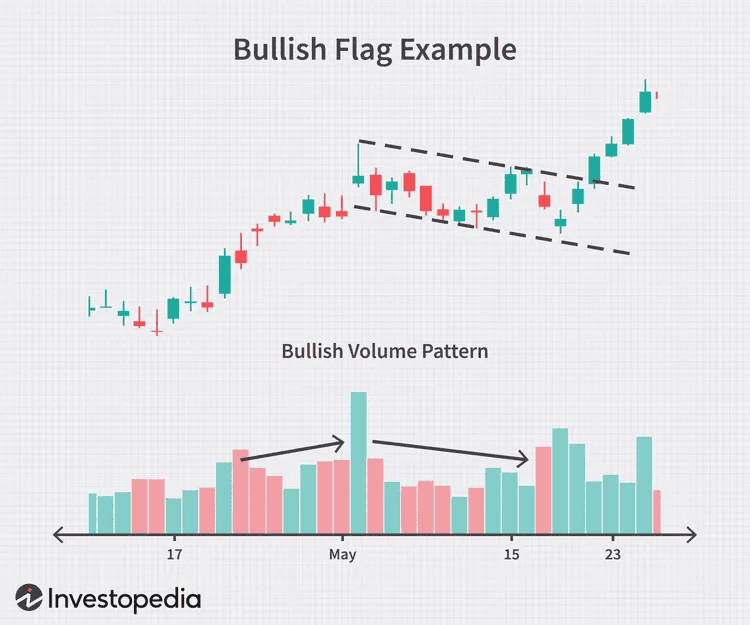
Flag pattern: It resembles a flag. It assists analysts in verifying the extensively relied upon and utilised by analysts as an indicator of the continuation of an existing market trend. recognisable by a steep countertrend followed by a flat top. Familiarity with these patterns can enable traders to invest at the right time because markets follow their earlier trends, presenting the possibility of swift price movements.
Combining Indicators & Patterns: Confirmation Strategies
No indicator is perfect; they sometimes generate false signals. Also, indicators are widely considered as lagging, so the signals are given once the price change occurs. Traders usually combine several tools, such as combining moving averages with RSI, then confirm trends based on chart patterns. For example, a bullish engulfing candlestick pattern, backed by rising MACD and strong volume, has a higher probability of winning in the trade. Combining various tools helps analysts filter out market “noise” and reduce errors.
AI-Assisted Trend Analysis in 2025
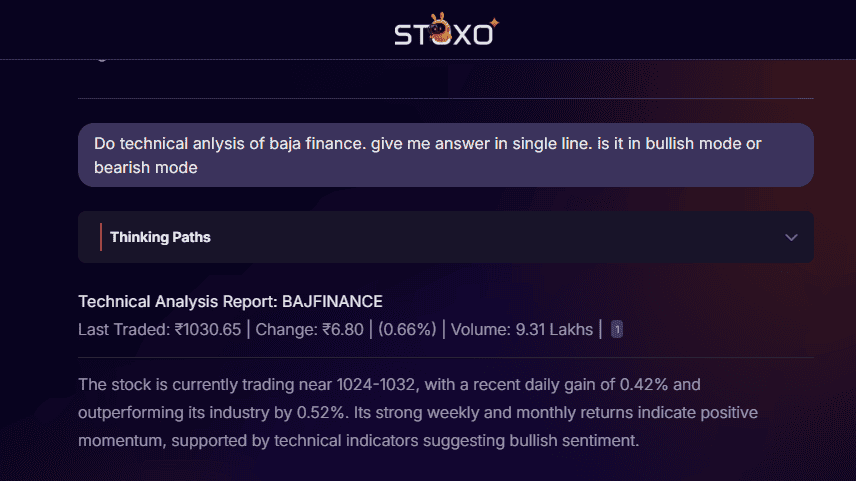
AI-assisted trend analysis has made the analyst’s life easier nowadays. Modern AI tools use machine learning methods to analyse huge amounts of data, including news analysis, sentiment analysis, trend prediction, and many more things. Stock recommendations by AI are your way out to quick and easy trend analysis in 2025. The data used by AI to analyse is very important because it will determine the accuracy of the output.
Let’s look at an example by asking Stoxo AI to analyse Tata Motors trends. The output is really astonishing as it correctly tells that the stock lacks momentum(11th Oct 2025) and also tells that currently it’s in bearish mode.
Step-by-Step Trend Analysis Workflow (with Examples)
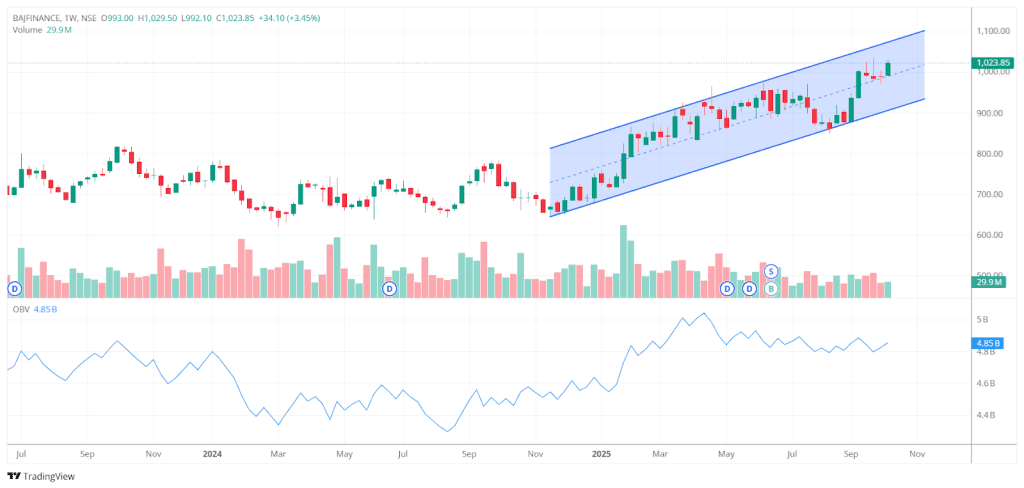
1. Stock Selection: Filter stock from the Nifty 50 index as it has the highest liquidity. Let’s say, for example, we choose Bajaj Finance for the analysis.
2. Analysing the chart and finding the Trend: First, select the weekly chart and analyze the last 15-20 weeks’ trend. Clearly, the chart below shows that the stock has been in a strong uptrend for the last 15-20 weeks. It uses a channel to understand the trend. You can also use moving average, RSI, and MACD to find the trend.
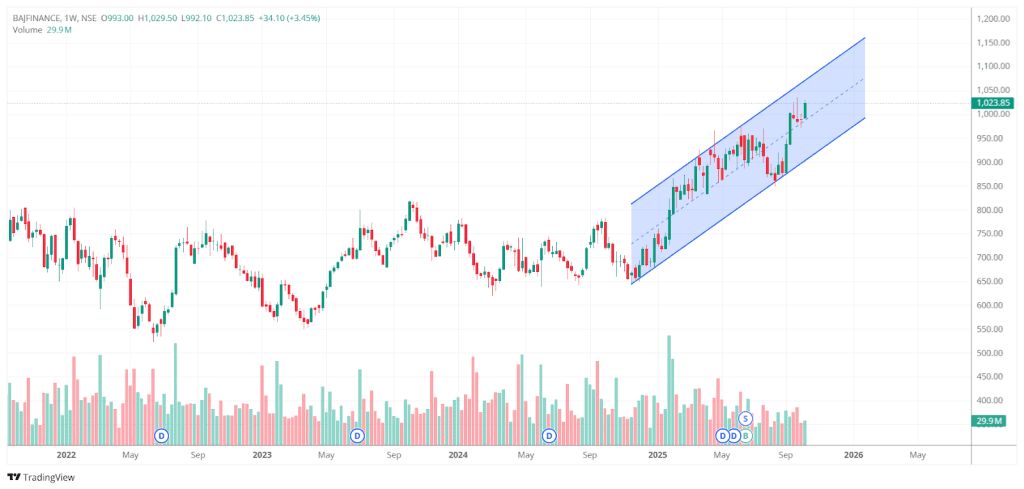
3. Volume Analysis: Check volume levels; strong trends are supported by high volume, visible in the OBV.
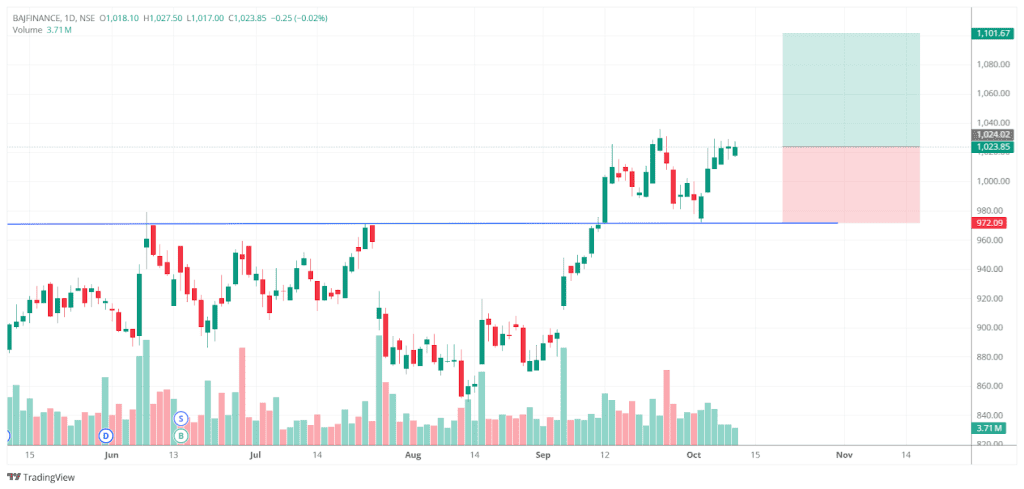
4. Entry, Stop-Loss, and Target: Since the stock is currently in an uptrend, the preferred approach would be to take a long (buy) position. Based on the chart, the nearest support level lies around ₹972, which can serve as the stop-loss. To maintain a healthy risk-to-reward ratio, we’ve assumed a ratio of 1:1.5, setting the target price at approximately ₹1,100.
Limitations: False Signals, Lag & Market Noise
No trend analysis method can perfectly predict the future with certainty. Indicators are usually based on past data and show signals only after a trend has started or finished. They sometimes also generate false signals due to the outlier movement of stocks, due to news, or any events. So this noise can give false signals & hit stop-loss. It’s important to combine technical analysis with sound risk management to cut losses quickly. This will avoid overtrading based on false signals.
Conclusion
Trend analysis is a crucial thing nowadays. Analysts start their initial analysis and base their buying and selling decisions on trend analysis using classic technical indicators and chart patterns. As this is a time-consuming process, AI-powered tools nowadays save major time to do the analysis; human interference is important in judgment and decision-making. AI-powered tools like Stoxo help traders and investors spot opportunities, manage risk, and work with market sentiment. While no tool guarantees success, combining up-to-date analysis and solid risk management is the key.
FAQ’s
It’s the study of price and volume data to identify ongoing market direction and make short and long-term trading/investing decisions.
Indicators such as Moving averages, MACD, RSI, and ADX are widely used to detect the trend. Combining 2 to 3 indicators can help understand trends.
High volume means high interest in that stock, which eventually strengthens the reliability of a trend. OBV gives an aggregated view of buying and selling pressure, aligning with price direction.
Chart patterns like triangles, head and shoulders, and flags are reliable patterns. But they can’t be used in isolation; they need to be used for confirmation along with other tools.
AI platforms help analyze charts, pattern recognition, technical analysis, and backtesting strategies. All these things are done within minutes, increasing speed and breadth of analysis. Human experience is still important for judgment and decision-making.
Analysts never completely rely on trends due to delays, false signals, and unpredictable market events. They usually prefer combining trend analysis with other factors like risk management, fundamental analysis, etc.
You can combine candlestick patterns with two or more technical indicators(RSI, MACD, volume) to strengthen your hypothesis and reduce risk.

Leave a Comment