Summary
MACD (Moving Average Convergence Divergence) helps identify trend direction, momentum, and potential reversals.
Adjusting MACD settings can improve signal accuracy for intraday trades.
Traders combine MACD with other indicators for confirmation before entering or exiting positions.
Best MACD Settings for Intraday Trading
Most charting platforms load MACD with 12, 26, 9 as the default. Those three numbers control how fast or slow the indicator reacts and on daily charts, they’re fine. Intraday though? Way too slow. You’re sitting there watching the lines finally cross while the stock has already moved ₹20. By the time you enter, half the profit window is gone.
Most intraday traders who’ve spent real screen time with MACD settle on faster combinations. The two that come up again and again are 5, 13, 1 for aggressive scalping and 8, 17, 9 for a slightly smoother read on 5-minute and 15-minute charts. The 5, 13, 1 setup reacts almost immediately to price shifts which means more signals, but also more noise. The 8, 17, 9 version filters out some of that noise while still being quick enough to catch intraday swings before they exhaust. If you’re curious about pairing these with other momentum tools, macd rsi strategy walks through how combining the two creates a stronger confirmation system than either alone.
Here’s a quick worked example. Say you’re watching Reliance on a 5-minute chart using 8, 17, 9 settings. The MACD line crosses above the signal line at ₹2,940 with the histogram turning green. You enter long, set a stop-loss at ₹2,925 (₹15 risk per share), and target ₹2,970 (₹30 reward). That’s a clean 1:2 risk-to-reward setup triggered by the crossover. On 100 shares, your risk is ₹1,500 and your potential gain is ₹3,000. The faster 5, 13, 1 setting would’ve fired that signal a candle or two earlier getting you in at maybe ₹2,935 but it would’ve also fired two false signals in the prior hour that the 8, 17, 9 setup filtered out.
What is MACD and How Does It Work?
MACD short for moving average convergence divergence sounds intimidating but it’s really not. Here’s what it does. It takes two moving averages that react at different speeds and measures the gap between them. That gap becomes a line on your chart. When recent prices are climbing faster than the longer trend, that line pushes up. When things cool off, it drops back down.
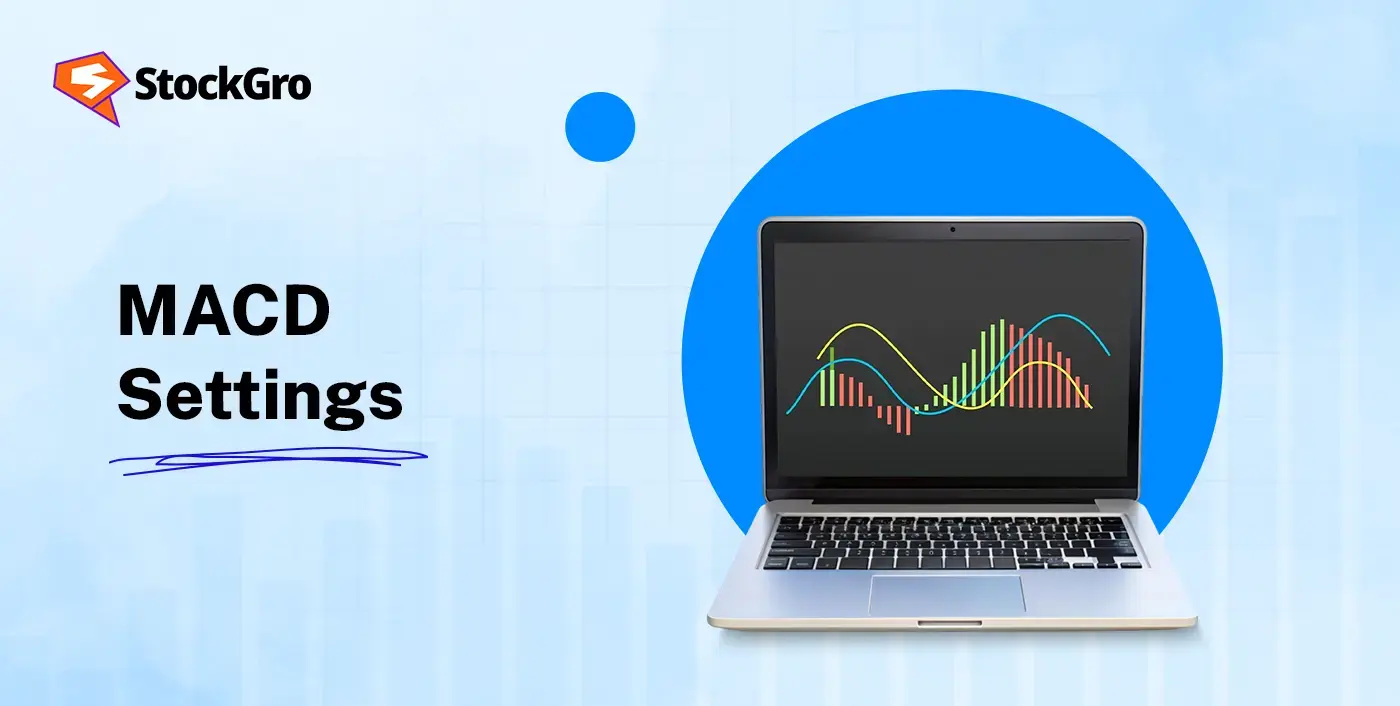
Now there’s also a second line called the signal line basically a smoothed version of the first. When the main line crosses above it, that’s traders’ shorthand for “momentum is picking up, might be time to buy.” When it dips below, the energy’s fading. And those little bars you see on the chart? That’s the histogram. It just shows the distance between the two lines. Big bars, strong move. Bars getting smaller? The momentum’s leaking out and that actually gives you a warning before the lines fully cross. Plenty of experienced traders pay more attention to those shrinking bars than to the crossover itself. If you want to see where MACD fits alongside other approaches, best intraday trading strategies covers the broader picture.
How to Use MACD for Intraday Trading Strategies
Signal line crossover the bread and butter. Wait for the MACD line to cross above the signal line, confirm with volume (is it above average?), and enter. This works best during the first two hours of the trading session when momentum is genuine, not just noise. Avoid crossovers that happen during the dead zone roughly 12:30 PM to 1:30 PM when volume dries up and false signals spike.
Histogram reversal the early warning. Don’t wait around for a full crossover every time. Keep an eye on those histogram bars instead. After a good run, if the bars start getting shorter, the move is running out of gas even if the price is still inching in the same direction. Already sitting in a trade? That’s your nudge to either move your stop closer or lock in some of the gains. I’ve watched Nifty on a 5-minute chart plenty of times where the histogram peaked and started shrinking a good two or three candles before the lines actually crossed. That kind of head start is gold when you’re trading intraday.
Zero-line crossover trend bias filter. Here’s a simple rule that saves a lot of bad trades. If the MACD line is sitting above zero, buyers have been stronger than sellers recently so lean towards buy setups. Below zero? Sellers are in charge, stick to sells. You’re not reacting to every wiggle, just using this as a broad “which side of the trade should I be on today” check. Say Tata Motors has MACD sitting at +0.8 on the 15-minute chart you’d skip any sell setups and focus only on buying opportunities until that number sinks back down.
Best Timeframes and Market Conditions for MACD Trading
The 5-minute chart is where most intraday MACD traders spend their time. It’s fast enough to generate actionable signals but slow enough to filter out the tick-by-tick noise that makes 1-minute charts borderline unusable with MACD. If you’re a bit more patient or trading options where you need slightly longer holding periods the 15-minute chart with 8, 17, 9 settings is genuinely solid. Fewer signals, but the ones you get tend to be higher quality.
Here’s something that’ll save you a lot of frustration early on the market condition matters just as much as your chart settings. Maybe more. See, MACD was built to catch trends. When a stock or index is moving with purpose a clean rally after earnings, a sharp sell-off on bad news MACD lights up beautifully. The crossovers mean something. The histogram bars grow with conviction.
But between roughly 12 PM and 2 PM on most Indian market days? Price just chops around doing nothing. And MACD keeps generating crossover after crossover during those flat stretches, each one looking like a signal but going absolutely nowhere. The histogram flips between tiny positive and tiny negative values like it can’t make up its mind. When you spot that, close the tab. Go grab lunch. MACD isn’t malfunctioning there’s just no trend to follow, and no setting in the world fixes that. The traders who actually make this indicator work aren’t trading more. They’re better at recognising which hours deserve their attention.
MACD vs RSI: Which Indicator is Better for Intraday Trading?
| Feature | MACD | RSI |
| What it measures | Momentum direction and trend strength | Whether price is overbought or oversold |
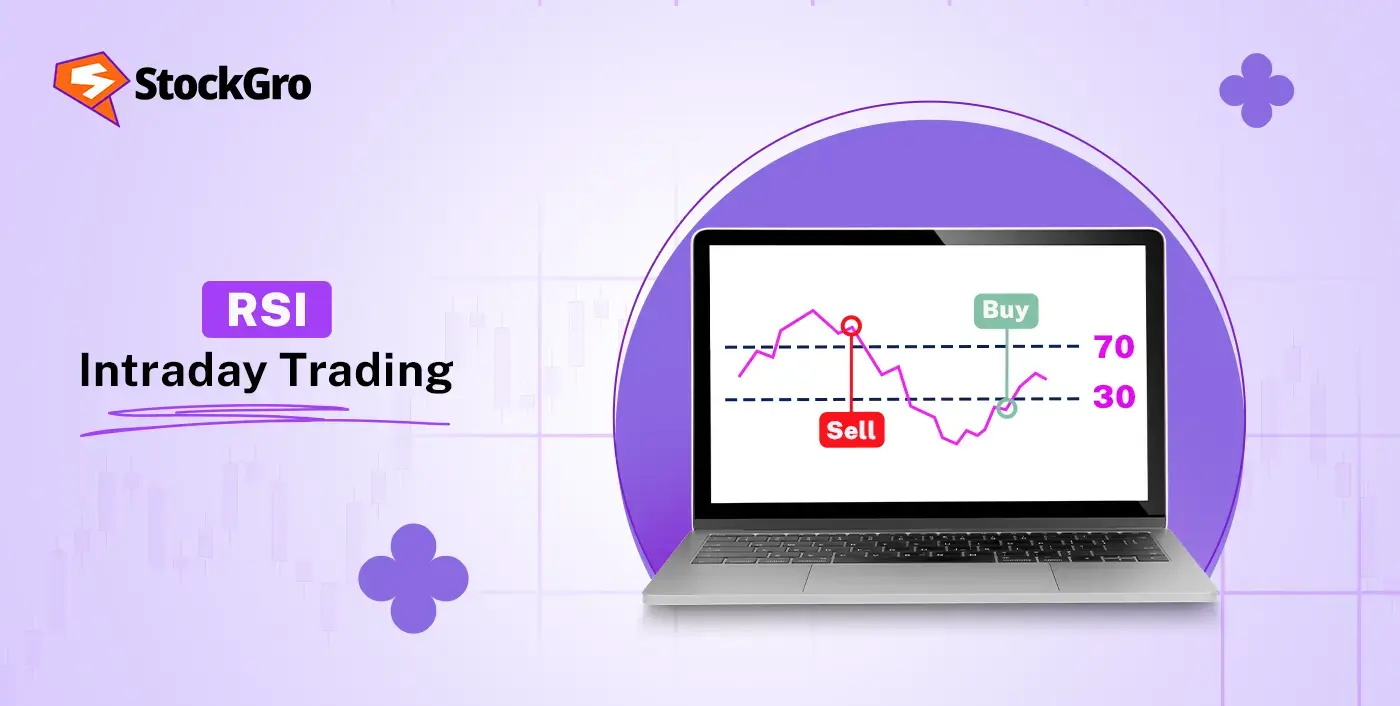
| Signal type | Crossovers (bullish/bearish) | Level-based (above 70 = overbought, below 30 = oversold) |
| Best market condition | Trending markets | Range-bound or sideways markets |
| Speed of signals | Slightly lagging confirms after the move starts | Faster flags extremes before reversals |
| False signals | Common in choppy, sideways sessions | Common in strong trending moves (stays overbought for ages) |
| Best use case | Catching and riding momentum swings | Timing entries at pullback extremes |
| Works alone? | Risky needs confirmation | Risky needs confirmation |
| Strongest pairing | MACD + RSI together for confirmation | RSI + MACD together for confirmation |
The answer is ? Neither is “better.” They solve different problems. MACD tells you which direction momentum is moving. RSI tells you whether price has stretched too far in one direction. Used together, they cover each other’s blind spots MACD catches the trend, RSI flags when the entry is overcooked. A crossover signal on MACD that fires while RSI is sitting around 40–50 (neither overbought nor oversold) tends to be much more reliable than one that fires with RSI already at 75.
Common Mistakes Traders Make While Using MACD
Using default settings blindly: The 12, 26, 9 setting was designed for daily charts in a different market era. On a 5-minute intraday chart, it lags badly. Spend a week testing 8, 17, 9 or 5, 13, 1 on your usual stocks you’ll see the difference in signal timing almost immediately.
Trading every single crossover: Not every crossover deserves your capital. If the histogram bars are tiny and flipping back and forth rapidly, the market is chopping sideways and MACD is just generating noise. Learn to distinguish between a crossover with conviction (growing histogram, rising volume) and one that’s going nowhere.
Ignoring the histogram: Most beginners only watch the crossover and ignore the histogram entirely. That’s like reading the headline and skipping the article. Shrinking histogram bars warn you that momentum is fading before the crossover even happens giving you a head start on exits and tighter stops.
Using MACD without any confirmation: Taking trades purely on MACD signals without checking volume, support/resistance, or a second indicator is a recipe for frustration. MACD is a trend-confirmation tool, not a crystal ball. Pair it with something RSI, VWAP, a simple price level and your win rate jumps noticeably.
Overcomplicating the settings: Some traders keep tweaking the numbers every week hoping to find a magic combination. There isn’t one. Pick a setting (8, 17, 9 is a great starting point), stick with it for at least 50 trades, and evaluate honestly. Constant tinkering just means you never learn how any single setup actually behaves.
Final Thoughts
Look, MACD is a genuinely useful tool but it’s a tool, not a trading system. It won’t tell you what to buy or when to sell all by itself. What it will do is give you a read on whether momentum is building or fading, and that’s valuable if you treat it as one piece of a bigger picture. Get comfortable with faster settings for intraday, pay attention to the histogram (not just the crossovers), and always cross-check with at least one other thing volume, a price level, RSI, something. The people who do well with MACD over time aren’t the ones with some secret setting nobody else knows about. They’re just disciplined enough to skip the trades that don’t fit and honestly, that’s the harder skill to develop.
FAQs
The 8, 17, 9 setting works well for most intraday traders on 5-minute and 15-minute charts. For faster scalping, 5, 13, 1 reacts quicker but generates more false signals.
8, 17, 9 hits the sweet spot responsive enough to catch moves early without the excessive noise that comes with ultra-fast settings. Test it on your usual stocks for a week before committing real capital.
Yes. It’s visually intuitive crossovers are easy to spot and the histogram gives a clear momentum read. Just don’t rely on it alone; pair it with RSI or volume for better accuracy.
No, not reliably. MACD generates too many false signals in choppy markets when used in isolation. Combining it with at least one confirmation tool (RSI, VWAP, or support/resistance levels) significantly improves results.
The 5-minute chart suits most intraday setups. The 15-minute chart gives fewer but higher-quality signals. Avoid 1-minute charts MACD lags too much to be useful at that speed.
Check the histogram for conviction growing bars mean real momentum, shrinking bars mean the signal is weak. Avoid crossovers during the midday lull (12:30–1:30 PM) when volume drops and false signals spike.