
Potential investment ideas need to be carefully considered before taking the final investment call. But does the stock really fit the bill? The answer is to constructively analyse it using well-established analytical frameworks that are already in place. Two major aspects of this analysis are fundamental and technical analysis. Don’t worry, this blog helps you understand these methods better, with a detailed overview of how to analyse share market efficiently.
How to Analyse the Share Market
The share market is a broad umbrella term that constitutes stocks, stock exchanges, regulations, market participants, and other components. A few essential terms that you must know as an investor are: bullish, bearish, and sideways market trend.
- A bullish trend occurs when the overall market sentiment is positive. The market is moving up, keeping investors’ confidence high. This typically suggests a buy zone for investors seeking an entry point.
- A bearish trend is seen when the overall market sentiment is negative. The markets are falling, leading to low investor confidence. Investors generally prefer to sell during this phase.
- A sideways trend takes place when there is no evidence of an uptrend or downtrend. Stock prices are moving within a tapered range. Investors usually wait for this phase to pass, then make their trading decisions.
These terms could sound confusing, but they are essential when determining your trades. Today, investors are taking advantage of AI stock advisors and platforms that evaluate trades efficiently. The main focus of share market analysis involves the usage of two approaches. Let us understand these.
Two Key Approaches: Fundamental vs Technical Analysis
Stock Analysis is broadly divided into fundamental and technical analysis. While fundamental analysis focuses on company-related investigation, technical analysis examines the stock’s movements in the market.
Both fundamental and technical analysis are mandatory to comprehend if the stock is a right buy. Together, they provide useful insights into the stock’s intrinsic value and price movements, given the overall market sentiment.
The following section studies both these approaches individually.
Fundamental Analysis: Assessing Intrinsic Value
Fundamental analysis involves studying the intrinsic value of a company through assessing financial statements, analysing key performance indicators and metrics, studying qualitative aspects of the company, and gaining an overall market perspective. This method stems from the idea that a company’s intrinsic value will eventually indicate its true price.
- Financial Statements (Income, Balance Sheet, Cash Flow)
The first step in fundamental analysis is to evaluate the stock’s financial statements. It provides foundational information on the company’s outlook.
- Income statement: A company’s income statement is the key to understanding if the company is profitable, operationally efficient, and growing. Looking at the revenue, costs, and profits enables the investor to truly understand the core operations of the stock and its viability.
- Balance sheet: Commonly referred to as the overview of the company’s financial positioning as on a particular date, a balance sheet provides exclusive insights into the structure and financial health of the company. Studying the balance sheet of a stock will provide a synopsis of the company’s assets and liabilities.
- Cash flow statement: Understanding the cash movements of the company is necessary in determining its valuation. A cash flow statement determines and segregates the activities that generate the ‘cash’ for the company. For example, activities include operating, investing, and financing.
- Key Ratios: P/E, P/B, ROE, Dividend Yield, etc
Ratio analysis for the company is a central component of fundamental analysis in the share market. For example, just as body vitals like blood pressure indicate what’s really going on inside your body, key ratios numerically indicate the financial health of the company. Ratios such as P/E, P/B, ROE, and Dividend Yield are often used to determine a company’s value and prospects.
- P/E, or the Price/Earnings Ratio, shows the company’s value in an investor’s eyes. It’s a quick measure to determine whether the stock’s valuation is correct or not. For instance, a P/E Ratio of 12 suggests that investors can pay ₹12 per share per unit of earnings.
- P/B, or the Price/Book value ratio, shows the company’s market capitalisation to its book value of equity. This ratio provides a perspective on the market’s valuation of the stock. For example, a P/B ratio of 9 suggests that the stock is trading at 9 times its book value.
- ROE, or Return on Equity, is used to measure the company’s ability to generate returns from its shareholder’s equity base. This metric is essential to estimate profitable investment opportunities. It is calculated as the company’s net income/ Shareholders’ Equity.
- Dividend Yield is used as a measure of the return in the form of dividends paid out to investors. This ratio is used to determine the investor’s potential return as dividends. The formula for dividend yield is (annual dividend per share/current market price per share)*100.
- Qualitative Review: Management, Brand & Moat
For an accurate fundamental analysis, a company’s qualitative review is also necessary. Qualitative analysis extends beyond figures and data. It estimates the company’s qualitative fundamentals like management quality, brand advantages, and moat.
- Management quality: Understanding the company’s leadership and management qualities helps investors determine if the company is in good hands. In fact, management quality assesses the company’s vision and prospects.
- Brand: A strong and respectable brand presence drives pricing power and customer loyalty. This helps businesses earn goodwill, which turns out to be a big asset for the growth of the business.
- MOAT: The competitive advantage a company holds over its peers is a key qualitative factor in fundamental analysis. A strong moat indicates that the company possesses a durable edge that protects it from competitors and supports long-term profitability.
- Macro and Industry Trends
Analysing the company’s macro environment and industrial trends is important in building the bigger picture for the company’s fundamental analysis. Factors such as GDP, interest rates, and employment trends could potentially impact the stock’s performance. For example, a rising GDP generally indicates economic expansion, which boosts consumer demand and corporate profits—ultimately driving stock prices higher.
Technical Analysis: Price Action & Market Trends
Technical analysis involves investigating and predicting price movements and directions using statistical patterns, data points, and trendlines. This analysis aims to accurately predict entry and exit points based on market movements. The scope of technical analysis is wide-ranging, with a variety of indicators in existence to provide investors and traders with accurate information.
Both fundamental and technical analysis complement each other. While one provides a long-term perspective on the stock, the other predicts and identifies entry and exit points to trade in.
- Chart Patterns & Candlestick Basics
Chart patterns visually represent the price movements of a stock or asset over time. They highlight trends that have been developed through historical price data, helping traders interpret market behavior.
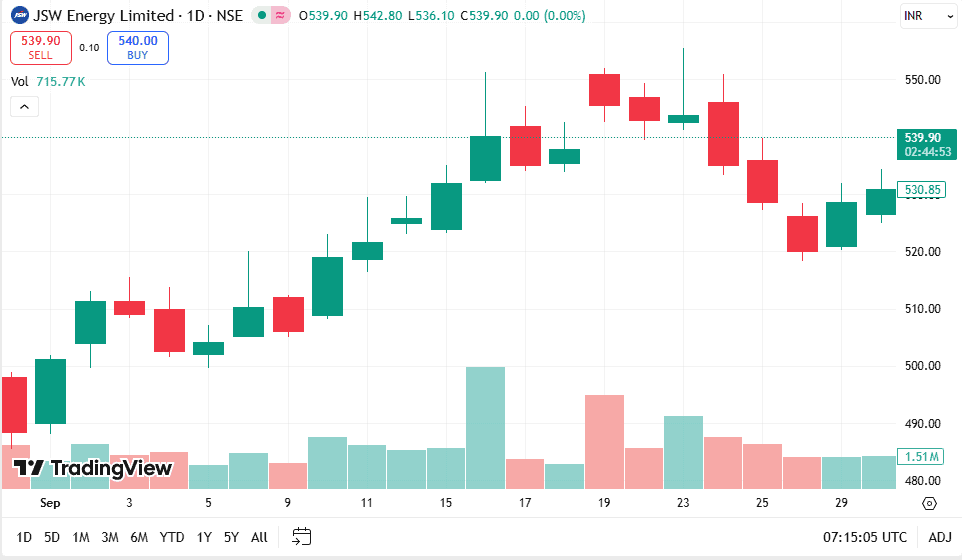
Candlestick patterns are a common type of pattern that is used to signal potential market movements. Each candlestick suggests price points like open, high, low, and close for a trader’s price movement predictions. Traders look at candlesticks to estimate bullish or bearish price reversals.
For example, look at the chart pattern of JSW Energy below, which is depicted in candlestick patterns. These candlesticks are used to depict the price movements of JSW Energy.
- Support, Resistance & Trendlines
Some widely used concepts in understanding price action trading for technical analysis are support, resistance, and trendlines. Support and resistance lines act like invisible barriers on a price chart. Support is the level where a stock tends to stop falling as buyers step in, while resistance is where prices often pause or reverse because sellers start taking control. They help traders spot entry and exit points.
Trendlines are visual depiction tools used on trading charts to indicate the prevailing direction of an asset or stock. These lines connect multiple price points to identify the trend direction for the stock. These trendlines help traders identify potential support and resistance.
- Indicators: RSI, MACD, Volume Analysis
Technical analysis applies technical indicators to estimate potential trades. Some of the most commonly used indicators are:
- Relative Strength Index (RSI): is used to measure the speed and strength of a stock’s price action. This indicator helps in spotting potential sell and buy points. RSI is measured between 0 and 100.
- Moving Average Convergence Divergence (MACD): is used to measure significant fluctuations in the stock prices. It’s used to identify potential trend reversals. It is used to check if the momentum of the stock is increasing or decreasing.
- Volume analysis: entails estimating the trading volumes of a stock to predict the future price movements. If the trading volumes are high, it is often considered a signal of price movement. Contrastingly, if the trading volume is low, it may be a sign of reversal.
Combining Both Approaches Effectively
Fundamental and technical analysis are complementary tools that help investors assess the worthiness of an investment opportunity. An integration of these approaches gives investors a complete picture of the underlying stock or asset.
This blend can be created by using parts of both analyses. Follow these steps to work through a hybrid approach:
- Stock picking: First, pick an appropriate stock that fits your investment goals and risk profile.
- Start with company fundamentals: Next, apply the basics of fundamental analysis to the stock, such as evaluating its financial performance, metrics, and growth potential.
- Qualitative factors: Additionally, consider the company’s leadership and management quality to determine prospects.
- Technical tools: Use technical platforms like Stoxo and other online tools available to analyse stocks.
- Identify potential entry and exit strategies: Through the analysis above, you can estimate potential entry and exit points for the stock.
How to Use Stoxo AI to Analyse the Share Market
Still confused about how to analyse the share market? Don’t worry, just use some simple prompts to conduct the research using Stoxo AI-powered analysis. You will have your research with you in under a minute.
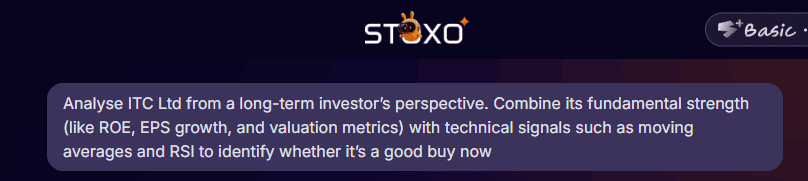
For example, consider analysing ITC Limited for you to invest in.
First, start by giving a custom prompt to Stoxo in your own words, as you want to conduct the analyses. The image below displays the prompt used by us.
The following results are generated by Stoxo:
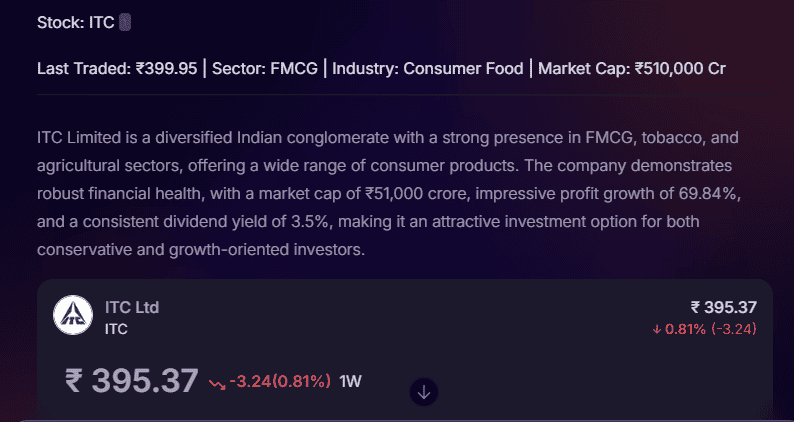
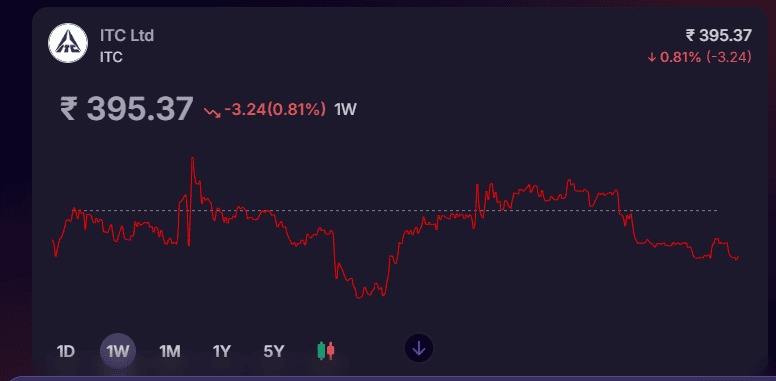
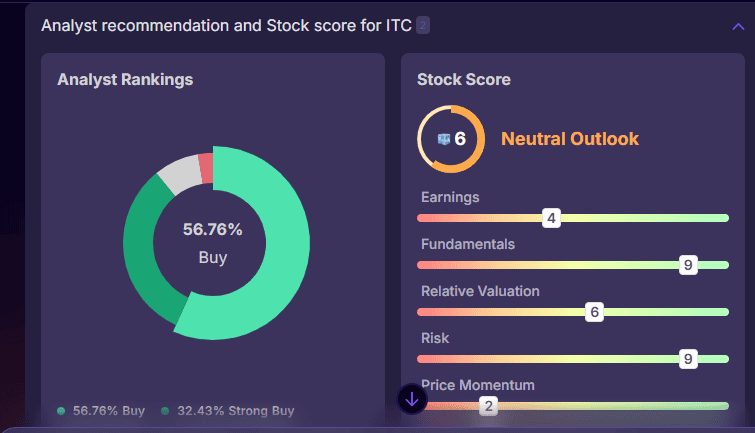
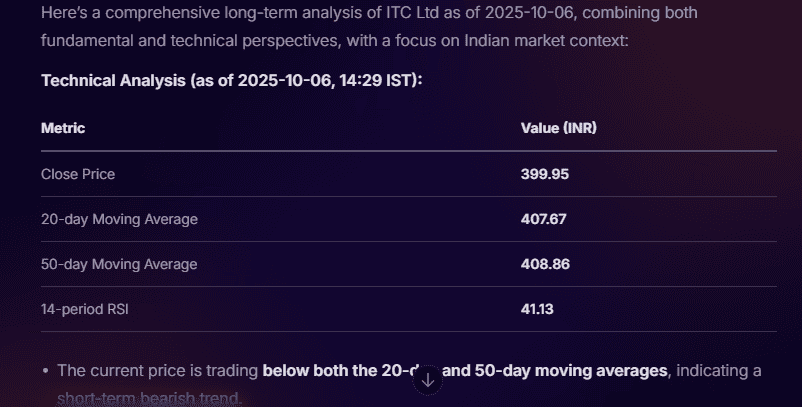
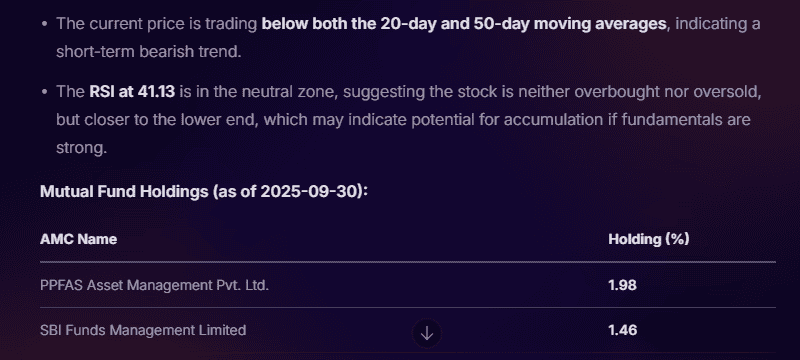
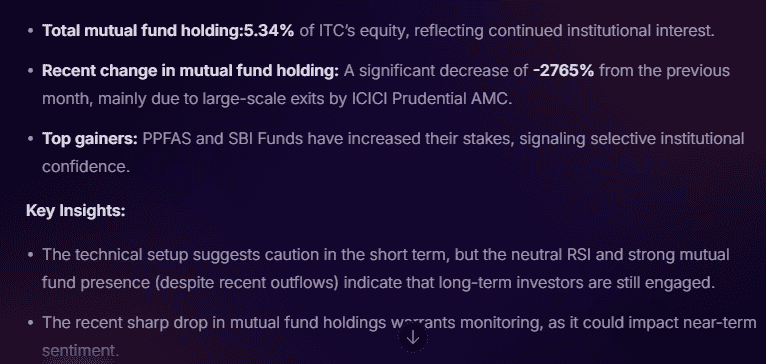
As is seen above, Stoxo provides a complete outlook on ITC, blending both fundamental and technical insights. The insights include a brief description of the stock, its recent stock price movements, analyst rankings, technical analysis indicators, and more.
The next time you want to conduct a share market analysis, Stoxo can be your AI stock advisor.
Conclusion
The share market is a complicated domain that requires thorough analysis and research. Beginners need to understand the two key approaches used in the analysis of share market stocks- Fundamental analysis and Technical Analysis. While fundamental analysis provides insights into the company’s future outlook using financials, metrics, and qualitative factors, technical analysis, on the other hand, sheds light on its future price movements using historical data. These approaches can be effectively combined using AI tools like Stoxo to generate more accurate insights that support investment decisions.
FAQs:
Share market analysis is the evaluation of stocks and companies. The analysis is done to estimate the viability of investing in a stock. Share market analysis comprises fundamental and technical analysis.
Fundamental analysis is the investigation of the company’s fundamentals using its financial statements, ratios, metrics, qualitative aspects, and industry analysis. This analysis focuses on capturing the long-term future perspective of the stock. On the other hand, technical analysis entails using charts, patterns, technical tools, and indicators to estimate the stock’s future price movements, entry, and exit points. Technical analysis captures the short-term picture of the stock.
Financial ratios like P/E, P/B, ROE, Dividend yield, etc, help investors understand the fundamental picture of the company. These ratios determine whether a company is under or overvalued.
Chart patterns and indicators keep a track on the price movements of the stock. Recognising specific patterns, such as head and shoulders or triangles, can signal potential trend reversals or continuations. Indicators like RSI or MACD add momentum and strength insights, helping traders time entry and exit points effectively. Together, they provide clues about market sentiment and possible future price directions.
Combine fundamental and technical analysis by first selecting strong companies through fundamental metrics like financial health and growth potential. Then use technical tools such as moving averages and RSI to time entry and exit points effectively, ensuring investments are both fundamentally sound and well-timed for market conditions.
AI tools make market analysis easier by quickly processing vast data, blending fundamental and technical analysis to predict trends accurately. They identify patterns, assess risks, and personalise insights, helping investors make informed decisions with greater efficiency and less emotional bias.
Stoxo is an AI-powered stock market analysis tool offering real-time data, advanced charting, technical indicators, fundamental analysis, and customised insights. It combines machine learning with expert research to help investors and traders make smarter, data-driven decisions confidently and efficiently.

Leave a Comment