
A rarely discussed but powerful filter in the process of how to choose a stock to invest is the impact of behavioral traps on long-term outcomes. Recent research shows that over 70% of retail investors in India admitted their stock selections were swayed by short-term news or trending social media discussions, rather than independent analysis or business fundamentals. In a market driven by rapid information cycles, learning how to choose a stock to invest goes beyond data, it’s about locating and resisting these psychological traps for more resilient decision-making. This guide discusses how these subtle forces shape choices, and how investors can sidestep common pitfalls to build a thoughtful equity portfolio.
How to Choose a Stock to Invest
Selecting stocks involves a structured process of research and analysis. To aid in this research process, new tools have been developed. One such tool is Stoxo by StockGro, an AI-powered research engine designed to provide retail investors with real-time stock market intelligence. It aims to consolidate research by allowing users to ask contextual questions and receive structured, credible answers, addressing the challenge of finding reliable, decision-ready information.
While advanced tools can streamline the data analysis phase, the overall strategic process for stock selection traditionally starts with few core steps which include the following:
Define Your Investment Goals & Risk Tolerance
The first and the foremost step in the stock selection process is defining personal investment objectives and risk tolerance. Investment goals represent the financial milestones you plan to accomplish, such as wealth growth or consistent earnings. Concurrently, assessing one’s risk tolerance, the degree of potential investment loss an individual is willing to endure helps in creating a suitable investment framework.
Decide Stock Type: Growth, Income, or Value
Stocks are often classified into several distinct types, including:
- Growth stocks: Shares of companies projected to expand faster than the overall market average. These companies generally reinvest their profits back into operations to support development instead of distributing dividends.
- Income stocks: Also known as dividend stocks, these are issued by established companies that pay out a regular portion of their earnings to shareholders in the form of dividends. They are sought by investors seeking a steady stream of income.
- Value stocks: These represent companies whose market price is lower than what their fundamentals and performance indicate.
Investors purchase these shares anticipating that their price will eventually align with the company’s actual value.
Use Top-Down vs Bottom-Up Strategy
Investors use different analytical strategies to select stocks, primarily the top-down or bottom-up approach. The top-down approach begins with analysing the broader economy and macroeconomic trends, then narrows down to identify promising sectors and industries before finally selecting specific companies within those sectors. On the other hand, the bottom-up approach focuses on individual companies, checking their fundamental analysis factors such as financial health, management, and competitive advantages, regardless of the prevailing industry or economic conditions.
Key Fundamental Criteria to Evaluate a Stock
Assessing a stock’s fundamentals involves analysing various quantitative and qualitative factors, as follows:
- Financial Health: Revenue, Profit Margins, ROE, ROIC
This is assessed using key metrics to understand a company’s profitability and efficiency, such as:
- Revenue: Refers to the total money a company earns through selling its products or services.
- Profit margins: A measure of profitability, calculated as profit divided by revenue.
- Return on equity (ROE): ROE shows how efficiently management utilizes shareholder equity to book profits.
- Return on invested capital (ROIC): ROIC indicates the profit a business generates from all the capital invested in it.
- Valuation: P/E, P/B, PEG, Margin of Safety
Valuation metrics help determine if a stock is fairly priced, overvalued, or undervalued. Common ratios are:
- Price-to-earnings (P/E) ratio: PE which compares the company’s stock price to its earnings per share.
- Price-to-book (P/B) ratio: PB compares a company’s total market value to its book or net asset value.
- Price/earnings-to-growth (PEG) ratio: PEG ratio divides a stock’s P/E value by its projected earnings growth rate.
- Margin of safety: This is the gap between a stock’s estimated intrinsic worth and its present market value.
- Management & Moat
Verifying the quality and experience of a company’s management team is yet another important qualitative factor. Additionally, assessing the company’s “economic moat”, its sustainable competitive advantage is crucial. An economic moat helps a company’s ability to safeguard its long-term profitability and market dominance from rivals.
- Debt Levels & Cash Position
A company’s debt can be understood by viewing its debt-to-equity ratio, which helps assess its financial leverage and risk. Excessive debt levels can be risky, particularly during financial slowdowns or recessions. On the other hand, a good cash position and strong liquidy, indicated by healthy cash flow and a good cash ratio, signals financial stability and the ability to cover short-term liabilities and fund growth.
Step-by-Step Using Stock Screeners
Once you have defined your fundamental criteria, the next practical step is to find companies that meet them. Manually searching through thousands of listed stocks is impractical, which is where stock screeners become essential. These tools allow you to filter the entire market based on the specific metrics you choose, efficiently narrowing down the options. Let’s walk through an example using Stoxo.
Step 1: Enter your query
The first step is to give the tool a clear instruction based on the fundamental criteria you’ve selected. For example, if you’re looking for fundamentally strong companies in the IT sector, you could use a prompt like this:
Find IT stocks with a P/E ratio under 25, revenue growth over 15%, a debt-to-equity ratio below 0.5, and an ROE greater than 20%.
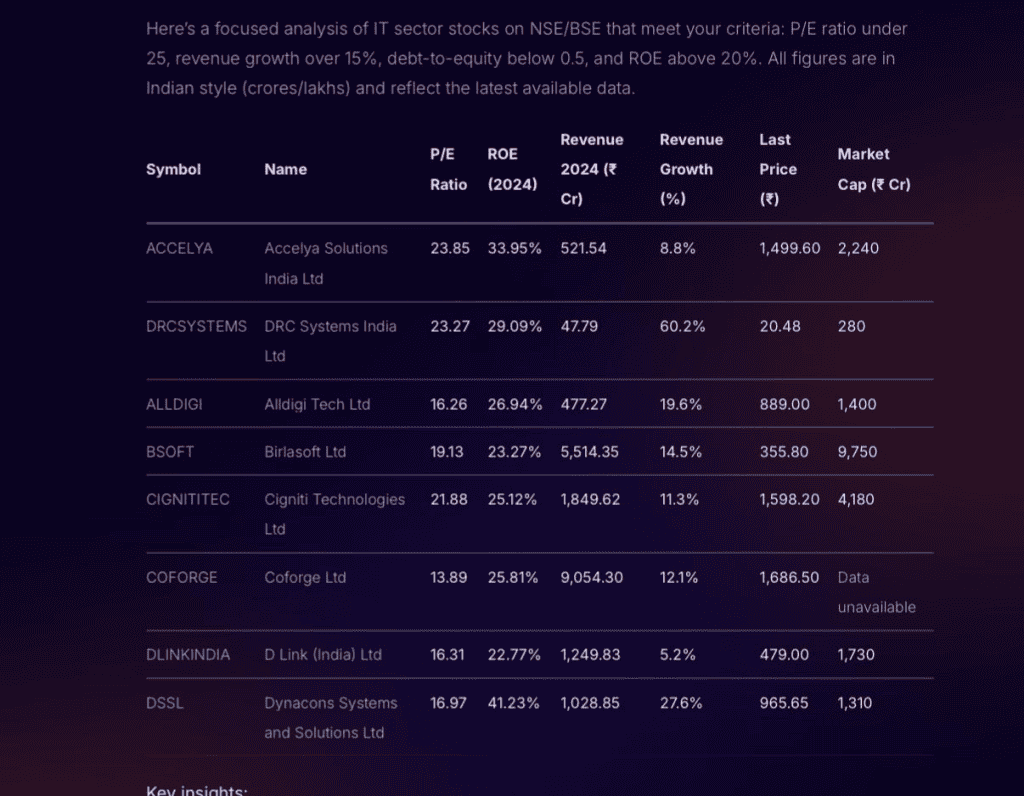
Step 2: Study the screened results and insights
In response, it provides a focused list of companies that match these precise criteria, as you can see in the image. The output not only presents a data table with relevant companies but also provides the main analytical insights.
It summarises the findings, confirms that the stocks meet the core P/E and ROE requirements, and showcases top performers based on metrics like revenue growth. This allows for a quick assessment of potential investment candidates before proceeding with deeper analysis.
Identify Institutional Interest & Ownership Trends
Another aspect of stock analysis is the examination of institutional ownership. The level of ownership by institutions like mutual funds, pension funds, and insurance companies can indicate the degree of confidence professional money managers have in a company. Analysts may monitor trends in institutional ownership; for example, a significant increase might be viewed as a positive signal, while widespread selling by institutions could be interpreted as a negative one.
Quick Technical Filters (for timing)
Although fundamental analysis assists in identifying what stocks to consider, technical analysis can be used to inform the timing of these decisions. Quick technical filters help uncover opportune moments to act. Some common indicators used for this are:
- Moving averages: These are employed to identify general price direction by averaging data over a chosen timeframe. Crossovers between two moving averages (for example, a 50-day line crossing over a 200-day line) are often viewed as possible trade signals.
- Relative strength index (RSI): This momentum oscillator tracks how fast and how much prices change over time. It functions within a 0–100 range and informs whether a stock might be overbought or oversold.
- Volume analysis: A significant increase in trading volume accompanying a price move can suggest a higher level of conviction behind that move.
Diversification & Portfolio Fit
When choosing a stock, think about how it complements your overall investment mix. Diversification means allocating money across different industries and asset types to manage risk. The main objective is to maintain investments that don’t react identically when market conditions fluctuate. Studies display that owning around 25–30 varied stocks can help limit company- or sector-specific risks. Each new stock should strengthen your portfolio’s balance, not increase exposure to one category.
Review & Reassess Over Time
Investing is a continuous process that demands consistent monitoring and thoughtful reassessment. The rationale behind purchasing a stock can evolve as the company’s financial position, competitive terrain, or the overall economic climate changes. By reviewing your portfolio regularly, you can:
- Track performance: Check out if each stock is delivering returns that match your initial expectations and investment thesis.
- Reassess core fundamentals: Examine if the company’s revenue growth, profitability, and leadership quality continue to support its long-term outlook.
- Maintain strategic alignment: Make certain your investment mix remains in sync with your financial objectives and tolerance for risk, both of which may shift as your circumstances and market conditions change.
Conclusion
Knowing how to choose a stock to invest is an ongoing process, not a one-time event. The real work begins after you buy, requiring a commitment to stay informed and periodically re-evaluate your decisions. Success in the market doesn’t come from finding a perfect formula, but from developing sound judgment and a resilient mindset. Focusing on strong businesses and keeping a long-term outlook enables smoother handling of market variations with ease. Following this approach allows you to build a strong portfolio positioned for future success.
FAQs
The first step is defining your financial goals and risk tolerance clearly. Decide if you want growth, income, or value stocks. This focus guides your research and helps you filter stocks that align with your investment objectives and comfort level with market fluctuations.
Valuation ratios compare stock price with earnings (P/E), book value (P/B), and growth (PEG). A lower P/E or P/B compared to industry peers may indicate undervaluation. PEG adjusts for growth, helping find stocks cheap relative to future potential. Use them together, not in isolation.
Strong management demonstrates good decision-making and strategy execution while an economic moat protects the company’s profits from competitors. Together, they signal sustainable competitive advantage, improving long-term profitability and reducing business risks, which are crucial for successful stock investment.
Check company shareholding patterns from stock exchanges or financial websites to identify high institutional ownership. Major and increasing institutional investment often reflects confidence from experienced investors. Monitor change trends as growing institutional stakes may signal potential stock strength.
Yes, beginners benefit from stock screeners, which help filter thousands of stocks using fundamental criteria like valuation, growth, and debt. Screeners simplify initial research by narrowing down options, making stock selection more manageable and focused on your investment goals.
Diversify across sectors, industries, and stock types to reduce risk. Holding 25 to 30 stocks spread over different areas can mitigate company- or industry-specific losses. Ensure new picks complement your portfolio, avoiding concentration in one sector to maintain balance and stability.
Review stock picks regularly, at least quarterly or biannually, to track performance and reassess fundamentals. Update holdings based on changes in company growth, market conditions, risks, or investment goals. Consistent review helps make timely decisions to optimise portfolio returns.

Leave a Comment