
According to the latest Sensex and Nifty 50 updates on 3 October 2025, the benchmark indices in India were traded with slight losses due to persistent FII sell-off, regardless of positive global indicators and a cautious pause by the RBI.
In such cases, volume analysis helps traders to evaluate if FII selling is actually significant or is short-term. Moreover, it helps to confirm price moves, spot possible reversals, and measure the strength behind market trends, which makes it a practical tool for informed trading decisions.
This blog provides a complete guide for understanding what volume analysis is in the stock market, volume indicators, volume divergence, and much more.
What Is Volume Analysis in stock market
Volume analysis is the assessment of the total stocks or securities bought and sold during a period. The technical analysts view trading volume as a probability of success of a trade. Volume analysis in stock markets can highlight various trends such as liquidity, reversal, bullish indicators, and more.
Key Volume Indicators / Tools for Analysis
The key volume indicators help investors to measure market conviction, buying and selling volume, identify trends, and much more.
On-Balance Volume (OBV)
The On-Balance Volume (OBV) evaluates the flow of money by adding high-volume days and subtracting low-volume days. The rising OBV line means more buy orders, which indicates a bullish trend, while a decline in the OBV line indicates more sell orders and a bearish trend. .
Accumulation/Distribution Line & Chaikin Indicators
The Accumulation/Distribution (A/D) Line provides insights into the underlying buying and selling pressure by taking price and volume under consideration. A rising line indicates dominance of buyers or accumulation, while a falling line indicates control of the seller or distribution.
Chaikin Money Flow (CMF) estimates money flow in and out of a stock over 21 days by comparing the closing price to the high and low prices, which is weighted by volume. Positive CMF signals buying pressure, negative indicates opportunities to sell
Volume Price Trend (VPT), PVI, NVI
Volume price trend (VPT): It is a volume indicator that calculates the balance between the demand and supply of a stock or security. It shows the price trend based on the demand and supply.
Positive Volume Index (PVI): It helps to track price movements, especially when trading volume increases. It shows retail traders’ participation in the stock market.
Negative Volume Index (NVI): The NVI tracks prices during low trading volume periods. It indicates the accumulation of institutional investors.
VWAP & Volume Moving Averages
Volume Weighted Average Price (VWAP): It shows the average price of a stock, based on volume and price. It highlights the demand, price, and trend of a stock.
Volume Moving Average: It calculates the average trading volume of a stock for a chosen period of time. It identifies volume trends and drivers of the market.
How to Read Volume Breakouts & Reversals
Here’s an overview of how to read volume breakouts and reversals:
How to read Volume Breakouts?
- Observe high volume: A breakout is often marked by a sudden rise in volume, which is significantly higher than average volume.
- Price alignments: The increase in volume should align with the timing when the price moves through resistance or goes below support.
- Steady price movements: The movement in price should continue in the same direction as in the breakout for several sessions of trading.
How to read Volume Reversals?
- Contrast: Observe opposite movement in the price and volume of a stock.
- Decreasing volume: If the volume decreases irrespective of an increase or decrease in the price, it indicates weak movement and a potential reversal point.
- Exhaustion: It is often marked by an aggressive movement of buying and selling and then a sudden drop in volume, which indicates the end of a trend.
Volume Divergence: What It Signals & How To Spot It
Volume divergence indicates any market reversal of a stock by showing the difference between its price and volume.
What does it signal?
- Weak momentum: Volume divergence suggests that the drivers of price are currently weak.
- Reversals: It might provide insights into a bullish trend reversing downwards or a bearish trend reversing upwards.
- Confirmation tool: It is used as a confirmation tool by traders to rely on it during entry or exit.
How to spot it?
- Price action: Traders can look out for the highest or peak price, or the lowest or trough point of price, while a stock moves.
- Volume action: Simultaneously, traders should also observe the volume of trades along with the price.
- Compare directions: Traders should look for whether price movement is higher high or lower low. Higher high along with declining volume indicates bearish divergence. While lower lows with increasing volume indicate bullish divergence.
Relative Volume, Volume Profile & Clustering
Relative Volume (RVOL): It is a ratio that compares the current trade volumes with the average historical trade volume over a short period of time. It is usually used to identify trends and breakouts by evaluating market participation.
Relative Volume (RVOL) = Current Volume/Average Volume
Volume Profile: It is a chart visualisation tool that shows trade volume at a specific price point over a period of time. It is used to identify certain price levels that might act as support or resistance.
Clustering: It is an approach that helps traders or investors to diversify their portfolios. It focuses on grouping stocks that have high correlation into one group and the ones with low correlation into another, which helps to analyse market behaviour.
Practical Use-Cases / Examples
Tata Motors’ 15-minute candlesticks with a Universal Breakout Strategy
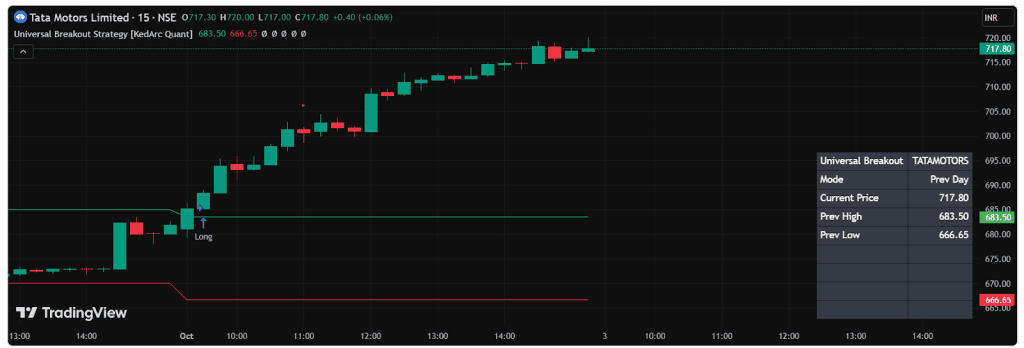
This chart shows Tata Motors’ 15-minute candlesticks with a Universal Breakout Strategy. A long entry was triggered above resistance at ₹683.50, the price surged upward, and the current levels trade near ₹717.80.
S&P 500 E-mini Futures: 15-minute timeframe with LuxAlgo’s Volume by Time Median
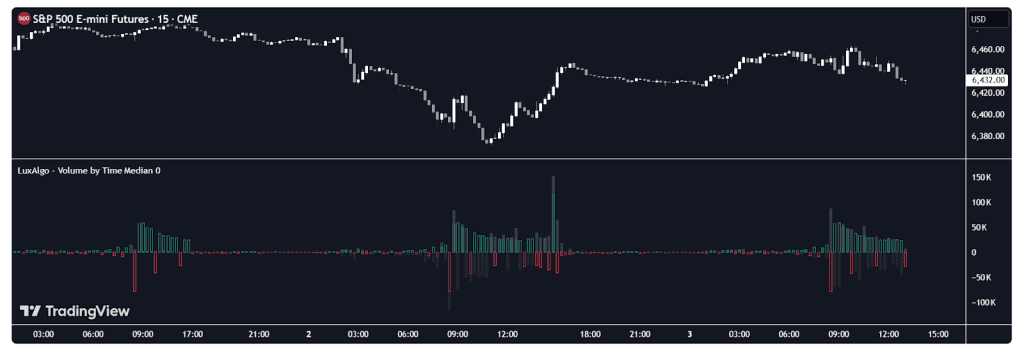
This chart represents S&P 500 E-mini Futures on a 15-minute timeframe with LuxAlgo’s Volume by Time Median indicator, showing price movement above and intraday volume spikes with positive (green) and negative (red) flows.
Combining Volume with Other Technical Tools
Combining volume analysis with other technical tools provides a more clear picture of trends, reversals or breakouts, while improving decision regarding entry and exit.
- Price action: This validates volume along with price moves. For example, a breakout high trade volume is more reliable compared to low trade volume.
- Trend lines and moving averages: Combining these, provides a more specific signal which confirms the direction of the market.
- Relative Strength Index (RSI): Volume analysis along with RSI provides weight to high buying and selling orders. When these two indicators align it shows possible reversal through divergence between them.
For traders looking to simplify this process, platforms like Stoxo, a stock market AI by Stockgro, can provide AI-driven insights to combine volume analysis with technical tools. It helps cut through market noise and highlight signals that actually matter.
Common Mistakes & Limitations of Volume Analysis
Common Mistakes of Volume Analysis:
- Heavy reliance on volume: Relying on volume without having a proper context of price action, market patterns, and other technical analysis could result in improper decisions.
- Misinterpretation spike in volume: An increase in volume might not always indicate a strong or sustainable trend. The spike can also be driven by speculation and manipulation.
- Avoiding market patterns: Based on sectors and markets, trade volume could have different movements and behaviours, and failing to understand that may lead to incorrect evaluation.
Limitations of Volume Analysis:
- Absence of objective: Volume analysis can not state the drivers of change in trade volume. For example, high trade volume does not specify whether it is due to an increase in buying or speculation.
- False or lagging indicators: Volume indicators may lag or provide false information during the trading period or while analyzing gaps in price.
- Difficulty in low-volume market: Volume analysis is less reliable in a low-volume market in comparison to a high-volume market. Low-volume periods are likely to be uncertain or misleading.
Conclusion
Volume analysis in the stock market helps to understand price moves, spot reversals, and evaluate market strength with the help of metrics like OBV, VWAP, and Chaikin. It shows high trade volume, which might indicate breakouts and divergences.
However, traders must avoid relying only on volume, as high volume might be a result of speculation, while indicators could lag or provide false signals in low-volume markets. Therefore, combining it with other technical tools would be more reliable for informed decisions.
FAQs
Volume analysis is the evaluation of the total stocks or securities bought and sold during a period. It is important for traders and investors as it confirms price moves, identifies its strength and reversal, and shows the interest of market participants in a stock.
The rising OBV line means more buy orders, indicating a bullish trend, while a decline in the OBV line indicates more sell orders and a bearish trend.
Absolute volume measures the number of trades or trade volume in a time period, while relative volume compares the current trade volumes with the average historical trade volume over a short period of time.
Yes, volume divergence can signal trend reversal when trade volume moves in the opposite direction to its price movement, which indicates weak participants’ conviction.
For using VWAP for intraday trading, traders can firstly add VWAP to the chart, identify trends and reversals, confirm volume, set stop loss, and lastly refine their strategy to improve over time.
The indicators that can confirm breakouts are On-Balance Volume (OBV), Volume-Weighted Average Price (VWAP), Accumulation/Distribution (A/D) line, Volume Price Trend, and Volume Moving Average.
Volume analysis lacks objectives or fails to show the actual drivers behind trade volume. It might be lagging or provide false indicators, while it is less reliable in low-volume markets.
Volume analysis in low-liquidity or small-cap stocks is different, as the smaller number of stocks traded and the volume is quite sensitive to individual transactions and is prone to speculation and manipulation, making volume indicators less reliable.

Leave a Comment