
Summary
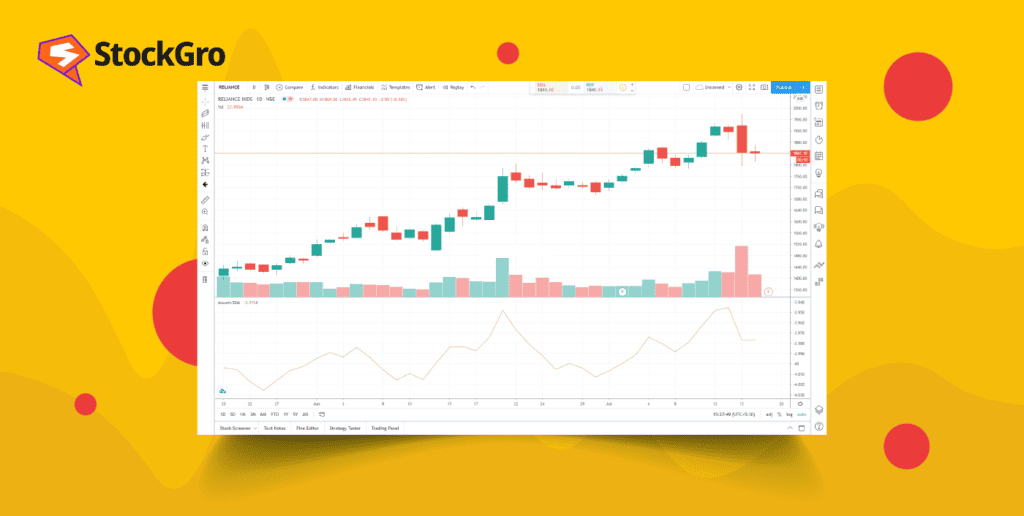
The Accumulation/Distribution (A/D) indicator measures buying and selling pressure by analyzing price and volume.
Rising values indicate accumulation (more buying), and falling values indicate distribution (more selling).
It helps traders confirm existing trends, anticipate reversals, and make informed entry or exit decisions.
What is the Accumulation/Distribution Indicator (A/D)?
The accumulation distribution indicator is a cumulative volume-based indicator. It incorporates volume and price to check how much money is flowing in and out of an asset. It primarily assists in measuring the current supply and demand dynamics in the market.
This further helps to understand if there is active buying (accumulating) or selling (distributing) happening in the securities.
Marc Chaikin was the analyst who developed the accumulation distribution line. He has also developed two other trading indicators known as the Chaikin oscillator and the Chaikin money flow indicator.
How the Accumulation/Distribution Indicator Works
The Accumulation/Distribution indicator integrates price location and traded volume to assess underlying market pressure, which translates daily trading activity into a cumulative measure of demand and supply.
- Price position within the range: The indicator evaluates whether the closing price occurs near the high or low of the session’s range to estimate buying or selling dominance.
- Volume weighting mechanism: The relative price position is multiplied by trading volume, while assigning a greater significance to the periods marked by heavier market participation.
- Cumulative line construction: The money flow value of each period is added to previous totals, which forms a continuous line that reflects sustained accumulation or distribution over time.
- Trend confirmation & divergence: The analysts compare the A/D line with the price direction to confirm trends or detect early signs of weakening momentum.
Accumulation/Distribution Formula
The Accumulation/Distribution indicator is constructed through a sequence of calculated steps that combine price range and volume into a cumulative measure of money flow.
Money Flow Multiplier:
| Money Flow Multiplier = [(Close – Low) – (High – Close)]/ High – Low |
This formula determines the relative position of the closing price within the trading range of the period.
Money Flow Volume:
| Money Flow Volume = Money Flow Multiplier x Volume |
The multiplier is applied to total trading volume to estimate the session’s effective buying or selling pressure.
Accumulation/Distribution Line:
| A/D Line = Previous A/D + Money Flow Volume |
The Money Flow Volume is cumulatively added to prior values, forming the Accumulation/Distribution line that reflects ongoing accumulation or distribution over time.
Calculation for the Accumulation/Distribution Indicator
To understand the calculation of the Accumulation/Distribution indicator, consider a simple trading session example.
Assume a stock records the following data for one day:
- High = 120
- Low = 100
- Close = 115
- Volume = 10,000 shares
Step 1: Calculate the Money Flow Multiplier
Money Flow Multiplier = [(115 – 100) – (120 – 115)]/(120 – 100) = 0.50
A positive value of 0.50 indicates that the closing price is nearer to the high of the range, suggesting buying pressure.
Step 2: Calculate the Money Flow Volume
Money Flow Volume = 0.50 × 10,000 = 5,000
This implies that out of the total traded volume, 5,000 shares are considered as effective buying pressure for that session.
Step 3: Update the A/D Line
Assuming the previous Accumulation/Distribution value was 20,000, the new value becomes:
A/D Line = 20,000 + 5,000 = 25,000
The A/D line rises to 25,000, reflecting accumulation during the session.
How to Read and Interpret the A/D Indicator
1. Rising A/D Line (Accumulation Phase)
When the A/D line is rising, it indicates that buying pressure is stronger than selling pressure. This suggests that investors are consistently accumulating the stock over time. It is generally considered a bullish signal, especially when confirmed with an uptrend in price.
2. Falling A/D Line (Distribution Phase)
When the A/D line is falling, it shows that selling pressure is stronger than buying pressure. This means investors are distributing or exiting their positions. It is typically seen as a bearish signal, especially if price is also weakening.
3. Bullish Divergence
Bullish divergence occurs when price makes lower lows but the A/D line makes higher lows. This indicates that selling pressure is weakening while accumulation is increasing. It often signals a potential upward reversal in price.
4. Bearish Divergence
Bearish divergence occurs when price makes higher highs but the A/D line makes lower highs. This shows that buying strength is fading even though price is rising. It is often an early warning of a possible downward reversal.
5. Confirmation of Trend Strength
The A/D indicator is best used as a confirmation tool rather than a standalone signal. Traders use it with price action, support/resistance, or indicators like RSI to confirm breakouts and reversals. This improves accuracy in stock market trend analysis and reduces false signals.
Trading Strategies Using the Accumulation/Distribution Indicator
- Trend Confirmation Strategy:
Traders use A/D to confirm whether a trend is strong. If both price and A/D rise together, it confirms bullish momentum in stock-market-trend-analysis. - Divergence Strategy:
When price makes higher highs but A/D makes lower highs, it signals weakening demand and possible reversal. - Breakout Confirmation Strategy:
A breakout above resistance with rising A/D confirms strong institutional participation. This reduces false breakout risk. - Swing Trading Strategy:
Swing traders use A/D to identify accumulation zones before entering positions. It helps in spotting early-stage trend reversals.
Benefits and Limitations of the A/D Indicator
- Combines Price and Volume for Better Accuracy: The A/D indicator integrates both price movement and trading volume, making it more reliable than indicators that rely only on price. This helps traders understand whether a move is supported by real market participation. As a result, signals generated are often more meaningful in identifying true market strength.
- Helps Identify Institutional Activity: One of the biggest advantages of the A/D indicator is its ability to hint at smart money behavior. Large investors often accumulate or distribute positions gradually, and A/D helps track this hidden activity. This gives traders an early edge before major price moves occur.
- Useful for Trend Confirmation: A rising A/D line during an uptrend confirms strong bullish momentum, while a falling line confirms bearish strength. This makes it an excellent tool for validating breakouts or trend continuation. Traders often combine it with other indicators for higher accuracy.
- Early Reversal Signals Through Divergence: A/D divergence can signal reversals before they appear on price charts. For example, when price rises but A/D falls, it signals weakening buying pressure. This early warning helps traders exit or reverse positions in time.
- Works Across Multiple Timeframes: The A/D indicator can be used in intraday, swing, and long-term trading strategies. Its flexibility makes it suitable for different trading styles. This adaptability increases its usefulness for both beginners and advanced traders.
Limitations of the A/D Indicator (Expanded)
- Does Not Consider Price Gaps: The A/D indicator does not fully account for gaps between trading sessions, which can distort readings. This is especially common in stocks affected by overnight news or earnings announcements. As a result, signals may sometimes appear inaccurate.
- Less Effective in Low-Volume Stocks:In illiquid stocks, volume data may not reflect true market participation. This can lead to misleading A/D signals. Traders should avoid relying heavily on A/D for penny stocks or thinly traded assets.
- Requires Confirmation from Other Indicators:A/D should not be used in isolation because it does not provide direct entry or exit signals. Traders must combine it with tools like RSI, MACD, or price action. Without confirmation, false signals can occur.
- Lagging Nature of the Indicator:Since A/D is cumulative, it reacts after price and volume changes have already occurred. This makes it slightly lagging in fast-moving markets. Traders should be cautious in highly volatile conditions.
- Can Be Misleading in Sideways Markets:During range-bound or sideways markets, A/D may show weak or unclear signals. This reduces its effectiveness for short-term decision-making. In such conditions, additional indicators are needed for clarity.
Common Mistakes Traders Make While Using the A/D Indicator
- Using A/D as a Standalone Signal Tool: Many traders mistakenly treat the A/D indicator as a direct buy or sell signal generator. In reality, it is a confirmation tool, not an entry trigger. Using it alone often leads to false signals and poor trade timing, especially in volatile markets.
- Ignoring Price Action Context: Another common mistake is analyzing A/D without considering the actual price chart. The indicator must always be read alongside support, resistance, and trend direction. Without price context, A/D signals can easily be misinterpreted.
- Misreading Divergences Too Early: Traders often act immediately when they see divergence between price and A/D. However, divergences can persist for a long time before a reversal occurs. Entering too early can result in premature trades and losses.
- Overlooking Volume Quality: Not all volume is meaningful. Some traders ignore whether volume spikes are genuine institutional activity or short-term retail noise. Weak or inconsistent volume can distort A/D readings and reduce reliability.
- Using A/D in Illiquid Stocks: Applying the A/D indicator to low-volume or penny stocks is a major mistake. In such cases, price and volume data are not stable enough to produce accurate signals. This often leads to misleading interpretations.
- Ignoring Market Trend Conditions: The A/D indicator works best in trending markets. Traders often misuse it in sideways or choppy markets, where signals become unclear. This reduces effectiveness and increases false interpretations.
- Not Combining with Other Indicators: Relying only on A/D without confirmation from tools like RSI, MACD, or moving averages is a frequent error. Combining indicators improves accuracy and helps validate trading decisions more effectively.
Real-World Use Cases of the A/D Indicator for Beginners and Active Traders
- Example 1: Pre-Breakout Detection
A stock consolidates sideways while A/D steadily rises. This indicates accumulation before a breakout. - Example 2: Institutional Selling Signal
Price remains stable but A/D declines consistently, showing hidden distribution by large players. - Example 3: Trend Strength Confirmation
During a strong uptrend, both price and A/D rise together, confirming sustained buying pressure. - Example 4: Reversal Warning
Price makes new highs but A/D fails to confirm, signaling weakening momentum and potential correction.
Conclusion
The Accumulation/Distribution Indicator is a powerful tool for understanding the flow of money in and out of a stock. By combining price and volume, it helps traders identify accumulation phases, distribution phases, and potential trend reversals.
When used with other indicators like RSI, moving averages, or price action strategies, A/D becomes a strong component of stock-market-trend-analysis and improves decision-making accuracy for both beginners and active traders.
FAQs
No. It does not predict trends but helps confirm them using volume and price behavior.
RSI, MACD, and moving averages work well for confirmation and improved accuracy.
It may produce false signals in low-volume stocks and does not account for price gaps.
Yes. Beginners can use demo trading platforms or paper trading to practice without financial risk.
Yes. In TradingView, search “A/D Line” under indicators and apply it directly to your chart for analysis.