Summary
VWAP (Volume Weighted Average Price) shows the average price a stock has traded at throughout the day, weighted by volume.
Traders use VWAP to identify trends, confirm intraday support/resistance, and optimize trade entry/exit points.
Proper VWAP settings depend on the timeframe and trading strategy to enhance decision-making accuracy.
What is VWAP Indicator Settings?
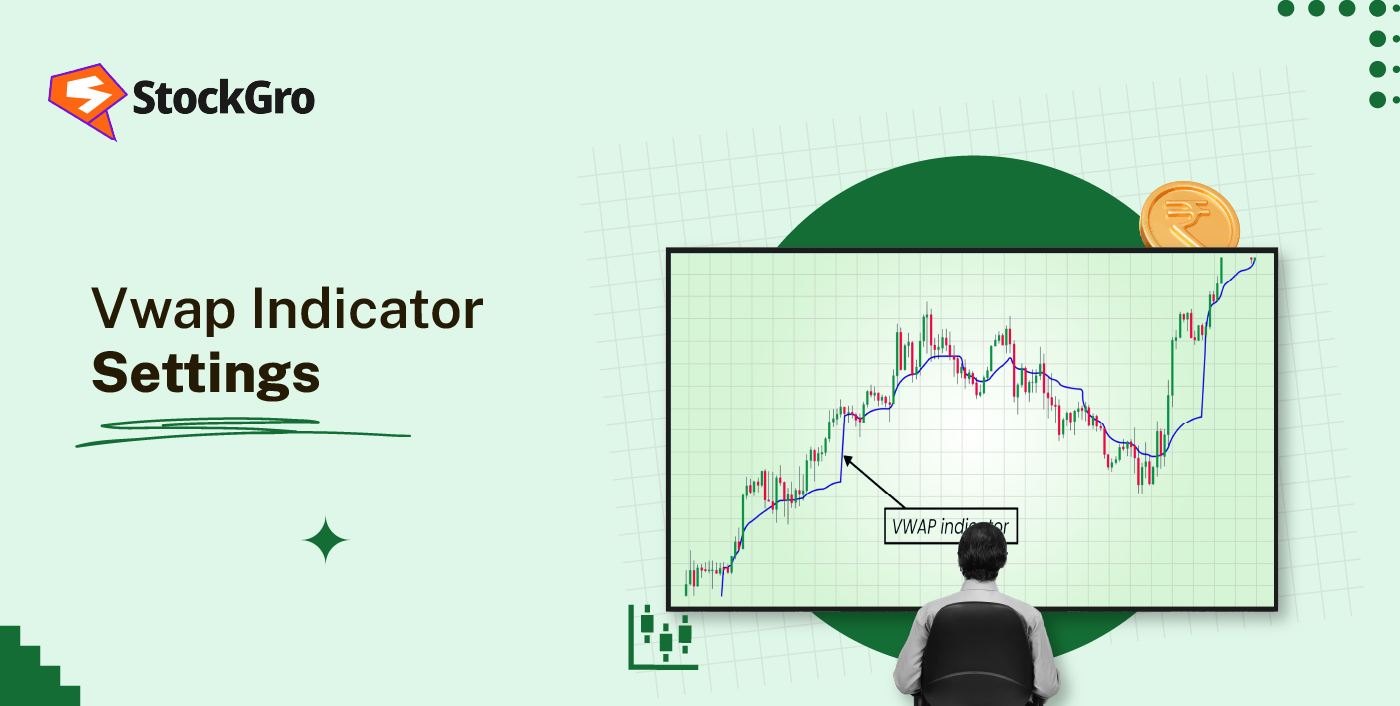
VWAP volume weighted average price calculates the average price of a stock throughout the day, but instead of treating every trade equally, it gives more weight to prices where higher volume occurred. So if 5 lakh shares of Reliance traded at ₹2,940 but only 20,000 traded at ₹2,960, VWAP pulls much closer to ₹2,940. It’s telling you where the bulk of the action happened, not where the outliers drifted to. For a fuller breakdown of the concept, vwap definition goes deeper into the maths.
The “settings” part is simpler than most people think. Standard VWAP doesn’t have adjustable parameters the way RSI or moving averages do it resets at the start of each trading session and calculates continuously from the opening bell. What you can adjust is the timeframe you apply it to, whether you add standard deviation bands around it, and how you combine it with other tools. For a wider look at which indicators pair well for intraday work,what are the best indicators for intraday trading covers the full toolkit.
VWAP = Cumulative (Price × Volume) ÷ Cumulative Volume
Quick example: if Infosys trades 2 lakh shares at ₹1,540 and then 3 lakh shares at ₹1,550 in the first thirty minutes, VWAP sits at (2,00,000 × ₹1,540 + 3,00,000 × ₹1,550) ÷ 5,00,000 = ₹1,546. That ₹1,546 is the “fair value” for the session so far prices above it suggest buyers are paying a premium; prices below it suggest sellers are in control.
How VWAP Indicator Works in Real Trading Scenarios
Scenario 1 VWAP as dynamic support (Tata Motors). It’s 10:30 AM and Tata Motors has been trading above VWAP since the open. The stock is at ₹735, VWAP sits at ₹728. Every time price dips towards ₹729–₹730, buyers step in and push it back up. That VWAP line is acting as a floor institutional traders use it as their benchmark price for the session, and their buy orders near VWAP create support that retail sellers struggle to break through. A trader watching this would enter long on the next dip to ₹730 with a stop at ₹724 and ride the trend as long as VWAP keeps holding.
Scenario 2 VWAP rejection signals a bearish day (Infosys). Infosys opens at ₹1,535 and immediately drops to ₹1,518 in the first 20 minutes on heavy selling volume. VWAP settles around ₹1,528. Over the next hour, price tries to recover it climbs to ₹1,526, then ₹1,529, but each time it touches VWAP, sellers knock it right back down. That repeated rejection at the VWAP line tells you sellers are firmly in control. The VWAP isn’t support here it’s a ceiling. A trader reading this correctly would avoid buying the dip entirely and instead look for short setups on each failed VWAP test, with stops just above ₹1,532.
Scenario 3 VWAP band overextension and mean reversion (Bank Nifty). Bank Nifty opens strong after a positive global cue and rallies from ₹50,100 to ₹50,550 by 10:15 AM. VWAP is at ₹50,280 and the price is now trading near the +2 standard deviation band. That’s statistically stretched too far from the session’s average too fast. Over the next 45 minutes, Bank Nifty pulls back to ₹50,310, almost exactly to VWAP, before stabilising. A mean-reversion trader would have shorted near ₹50,520 with a tight ₹80 stop and a target back towards VWAP at ₹50,280 a ₹240 gain on ₹80 risk. This kind of rubber-band snap back towards VWAP happens almost daily on strong opening moves that run out of follow-through volume.
Best VWAP Indicator Settings for Different Trading Styles
| Trading Style | VWAP Setup | Standard Deviation Bands | How to Use It |
| Scalping (seconds to minutes) | Standard VWAP on 1-min chart | ±1 SD bands | Enter on touches of VWAP; fade moves to ±1 SD bands for mean reversion |
| Momentum intraday (15 min–2 hours) | Standard VWAP on 5-min chart | ±2 SD bands | Stay long above VWAP, short below; use ±2 SD as overextension warning |
| Positional intraday (holding most of the session) | Anchored VWAP from session open | No bands needed | Use VWAP as a trend filter only buy when price sustains above it |
| Multi-day analysis | Anchored VWAP from a key date (earnings, breakout) | ±1 SD optional | Anchor from a significant event to see the “fair price” since that catalyst |
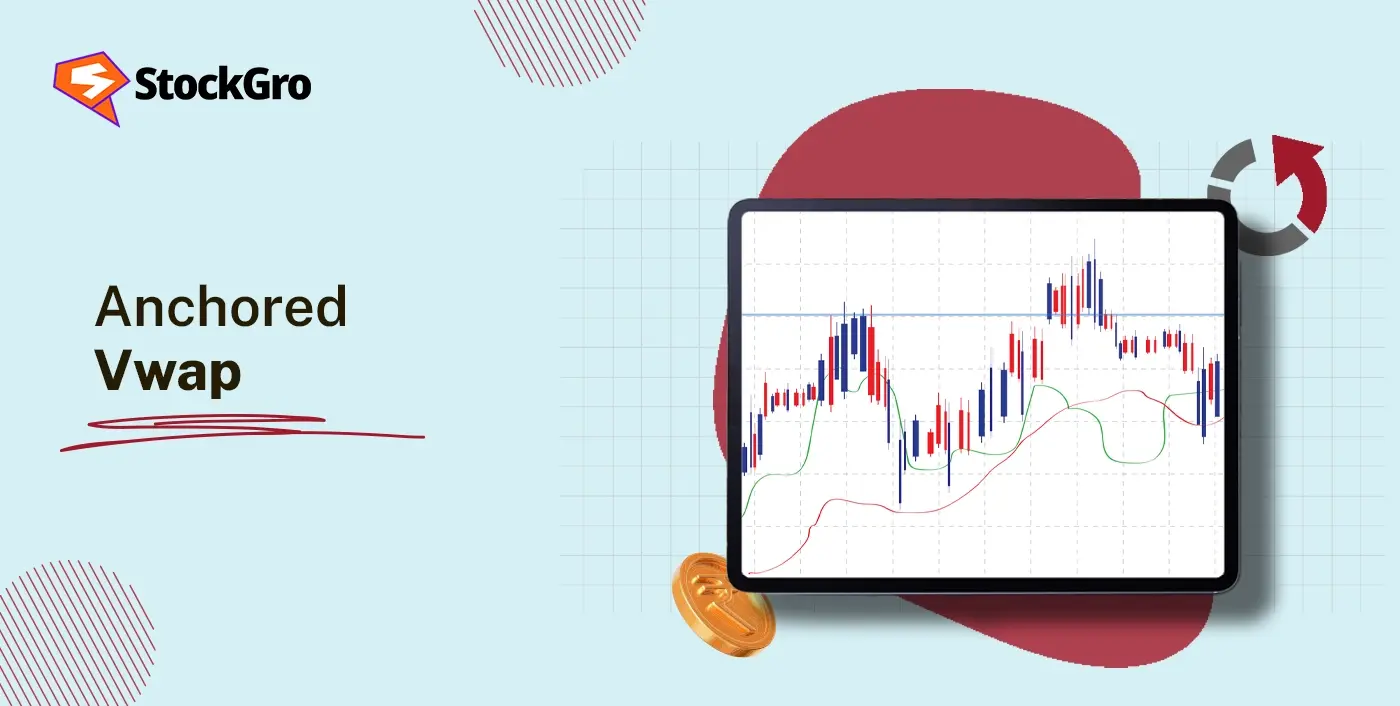
The anchored VWAP deserves special attention. Standard VWAP resets daily, but anchored VWAP lets you pin the calculation to any specific bar the start of an earnings gap, a breakout candle, or the beginning of a sell-off. This shows you the average price participants have paid since that event, which is incredibly useful for identifying support and resistance zones that standard daily VWAP can’t capture.
VWAP Trading Strategies Beginners Can Practice
VWAP pullback entry: Wait for a stock to establish a clear trend direction in the first 30 minutes above VWAP for bullish, below for bearish. Then wait for a pullback to VWAP and enter in the trend direction. Say Bank Nifty opens strong and trades above VWAP at ₹50,200. Around 10:45 AM, it dips back to ₹50,100 (touching VWAP). You enter long at ₹50,120 with a stop at ₹49,980 (₹140 risk) and target ₹50,350 (₹230 reward). The logic is simple VWAP pullbacks in trending sessions are where institutional buyers reload their positions.
VWAP band fade: When the price stretches to the +2 standard deviation band above VWAP, it’s statistically overextended too far, too fast. A mean-reversion trader would short near the upper band with a target back towards VWAP. This works best in range-bound sessions where there’s no strong directional catalyst. Important caveat don’t fade on trending days. If a stock gaps up on earnings and keeps running, the bands keep expanding and fading into that strength will get you crushed.
Common VWAP Mistakes Traders Should Avoid
Using VWAP on daily or weekly charts: VWAP is a session-based indicator. It resets every day. Applying it to a daily chart where each bar represents a full session makes the reading meaningless you’re averaging one data point against itself. Stick to intraday timeframes: 1-minute, 5-minute, or 15-minute charts.
Buying just because price is above VWAP: Price above VWAP tells you buyers have been stronger today. It doesn’t mean the stock will keep going up. You still need a setup a pullback, a volume confirmation, a support level. VWAP provides context, not a trigger. Treating it as a buy signal on its own leads to entries at the worst possible moments.
Ignoring the first 15 minutes: VWAP is unstable in the opening minutes because there’s very little data to work with. Two or three large orders can drag VWAP wildly in either direction before enough volume accumulates to stabilise it. Most experienced traders wait until 9:30–9:45 AM before trusting the VWAP line.
Fading strong trends near the bands: The +2 SD band is an overextension warning, not an automatic reversal signal. On a day where a stock is genuinely trending breaking news, sector rotation, earnings surprise price can ride the outer band for hours. Fading into that kind of momentum is how people take big unnecessary losses.
Not combining VWAP with anything else: VWAP by itself tells you where institutional fair value sits. But fair value doesn’t equal direction. Pair it with volume confirmation, support/resistance, or a momentum indicator for a complete picture. VWAP plus one confirmation tool beats VWAP alone every time.
VWAP vs Other Popular Trading Indicators
| Feature | VWAP | RSI | EMA | MACD |
| What it measures | Volume-weighted average price for the session | Overbought / oversold momentum | Trend direction via weighted price average | Momentum shifts between two moving averages |
| Resets daily | Yes | No | No | No |
| Volume-aware | Yes core to the calculation | No | No | No |
| Best for | Fair value and trend bias | Timing entries at extremes | Trend following | Catching momentum shifts early |
| Works alone? | Risky needs confirmation | Risky needs confirmation | Risky needs confirmation | Risky needs confirmation |
| Strongest pairing | VWAP + RSI or VWAP + EMA | rsi strategy for intraday trading | ema exponential moving average | macd indicator |
The real takeaway from this table? None of these indicators work reliably alone. But VWAP brings something the others don’t volume weighting. RSI, EMA, and MACD are all calculated purely from price. VWAP factors in how much actually traded at each price, which makes it inherently more connected to institutional activity.
How Beginners Can Use VWAP to Build Trading Confidence
Step 1 Observe for two weeks, don’t trade. Add VWAP to a 5-minute Nifty chart and just watch. Notice when price bounces off the line (support), when it gets rejected by it (resistance), and when it doesn’t seem to matter at all (range-bound, low-volume afternoons). This observation phase builds the kind of intuition no YouTube tutorial can hand you.
Step 2 Start spotting session patterns. After a week or so, you’ll notice things repeating “price respects VWAP in the first two hours but gets sloppy after lunch” or “trending days barely pull back to VWAP after the initial push.” Write these down. They’re the foundation of your trading rules and they came from your own screen-time, not someone else’s.
Step 3 Paper trade five setups. Pick one strategy the VWAP pullback entry works well for this and take five simulated trades using a paper account. Record every detail: entry price, stop, target, what VWAP was doing, and how you felt during the trade. Don’t skip the feelings part. Knowing that you panicked at a ₹80 drawdown is useful data.
Step 4 Journal and review after 20 trades. Once you’ve logged 20 paper trades, sit down and review honestly. What’s your win rate? Is your average winner bigger than your average loser? Are certain times of day producing better results? The numbers will tell you whether your approach actually works or whether it just felt like it did in the moment.
Step 5 Deploy real capital at minimum size. If the paper results are positive, move to real money with the smallest position your broker allows. The goal here isn’t profit it’s proving to yourself that you can follow your rules with real rupees at stake. Scale up only after another 20–30 live trades confirm that your edge holds under real conditions.
Final Recommendation
VWAP is the closest thing intraday traders have to an institutional cheat sheet it shows you where the big money traded, not just where the price went. Keep the settings simple (standard VWAP, add ±1 or ±2 SD bands if you want mean-reversion zones), respect the first-15-minutes rule, and always pair it with at least one confirmation tool. The traders who get real value from VWAP aren’t doing anything fancy. They’re watching price interact with one line, waiting for a clean setup, and skipping everything that doesn’t meet their criteria. That discipline not the indicator itself is what makes it work.
FAQs
Yes, it’s arguably the single most useful intraday indicator. It shows you the session’s volume-weighted fair value in real time, which is exactly the benchmark institutional traders use for their execution.
Yes. It’s visually simple one line on the chart and the concept is intuitive. Spend two weeks observing how price behaves around it before placing any trades based on it.
Not the standard version, since it resets daily. Anchored VWAP pinned to a key date like earnings or a breakout works well for multi-day analysis by showing the average price since that event.
For intraday, often yes because VWAP incorporates volume, which moving averages don’t. For swing or positional trading on daily charts, moving averages are more appropriate since VWAP is session-based.
Not directly. It shows you where fair value is, and strong moves away from VWAP (especially to ±2 SD bands) suggest overextension that often leads to mean reversion. But it’s a probability read, not a prediction.