If you have been dabbling in virtual stock trading, you have probably seen charts full of colourful candles. Some are tall, some are tiny, and some look like they’re wearing hats! Among these, the bearish pin bar is one of the most powerful patterns traders watch for.
Why? Because it can provide you a hint about when a price rise might be going to slow down or even go the other way. Being able to see this pattern can make a major difference for traders. Let’s break it down.
What is a Bearish Pin Bar?
A bearish pin bar is a single candlestick pattern that traders use to look at price action. It usually means that the market might soon go down.
The candle demonstrates that buyers sought to raise the price, but sellers jumped in and pushed it back down hard. The candle has a long top shadow (wick) and a small genuine body near the bottom.
In simple words, it is like the market saying, “Nice try, buyers, but not today!”
How to Identify a Bearish Pin Bar
A bearish pin bar is an easy candlestick pattern to find if you know what to look for. The top wick of most candles is more than twice as long as the body. This is the most noticeable aspect of the candle. This demonstrates that the price rose up quickly during the session but then fell back down.
The body is small and sits close to the candle’s low, telling you that sellers pulled the market back down before the close. In many cases, there’s little to no lower wick, which means selling pressure stayed strong right until the end of that period.
Psychology Behind the Bearish Pin Bar
Charts aren’t just numbers and shapes, they are stories of human behaviour.
When you see a bearish pin bar, it tells a story:
- Buyers started strong and pushed prices up.
- Sellers fought back harder, smashing prices down.
- The day ended near the low, showing seller dominance.
This shift means market sentiment has changed. The crowd that was excited about higher prices is now doubtful, and bears are taking control.
Bearish Pin Bar vs Bullish Pin Bar
| Feature | Bearish Pin Bar | Bullish Pin Bar |
| Wick direction | Long upper wick | Long lower wick |
| Body position | Near candle low | Near candle high |
| Signal type | Possible downtrend | Possible uptrend |
| Market story | Sellers overpower buyers | Buyers overpower sellers |
Think of them as mirror images. A bullish pin bar hints at rising prices, while a bearish one suggests the opposite.
How to Trade a Bearish Pin Bar
Once you have identified a bearish pin bar, the next step is knowing how to trade it with discipline. In technical analysis, the idea is to use the candlestick as a sign of rejection at higher prices and position yourself for a potential downside move.
Here’s a simple plan for using the pattern:
- Entry: Wait for the bearish pin bar to form near a key resistance level. Enter a sell trade once the next candle breaks the low of the pin bar.
- Stop Loss: Place your stop loss just above the high of the pin bar. This keeps you safe if the market goes against you.
- Take Profit: Find the next level of support or employ a reward-to-risk ratio that you like.
Example:
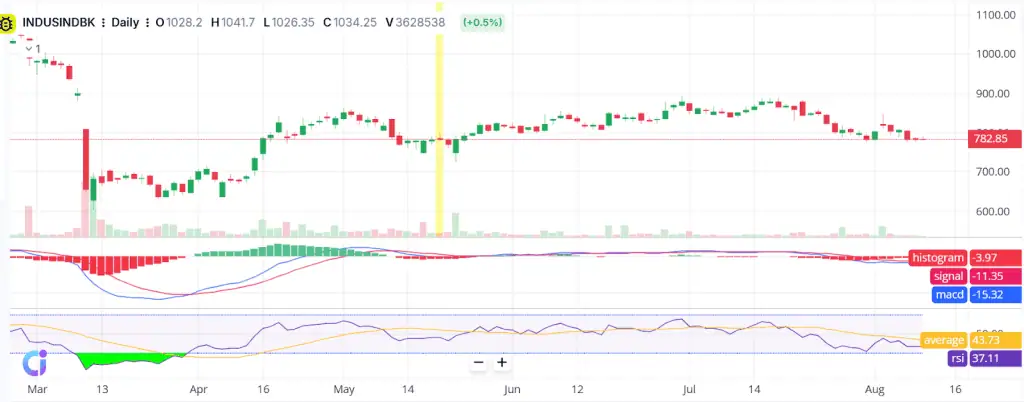
In the chart above (INDUSINDBK, Daily), a perfect example appeared on 20th May. During that session, price rallied sharply but met a wall of selling pressure. This left a long upper wick and a small body near the session’s low, with almost no lower wick, a textbook sign that buyers were rejected and sellers took charge.
After this bearish pin bar formed, prices stopped pushing higher and soon moved sideways to slightly lower over the next sessions, confirming the pin bar’s warning sign. Traders who acted on this signal had a well-timed entry, managed risk, and quickly saw a reward as the market lost bullish energy.
Best Timeframes & Markets for Bearish Pin Bar
Bearish pin bars work best on daily, 4-hour charts and 1-hour charts, where price action is clearer and fewer false signals occur. You can use 1-hour or 15-minute charts for intraday trading, but always confirm with a higher timeframe to avoid noise.
In the equity market, liquid stocks show reliable pin bar setups, while forex and crypto markets offer high liquidity but require care around sudden spikes. For longer-term signals, weekly charts highlight major reversals, though trades need wider stops and more patience.
Always check overall trend and key support or resistance before acting.
Common Mistakes When Trading Bearish Pin Bars
- Trading every wick you see: Not every long wick is a bearish pin bar. Context matters.
- Ignoring the trend: A bearish pin bar is stronger in a downtrend or near resistance.
- Forgetting confirmation: Jumping in without waiting for the next candle can lead to false signals.
- Poor risk management: Skipping stop losses can turn a small mistake into a big loss.
Conclusion
The bearish pin bar is a simple yet powerful candlestick pattern. It tells you when sellers have stepped in to push prices lower.
For young traders, learning to spot it and knowing when not to trade it, can boost decision-making skills. Always practice in virtual trading before going live, and use it with other analysis tools to keep risk under control.
Charts could look hard to interpret at first, but patterns like the bearish pin bar make them easier to understand. When you start to observe these indications, the market stops sounding like random noise and starts to sound like a conversation you can follow.
FAQs
A bearish pin bar implies that sellers are in charge after buyers sought to drive the price up. It often means that the price might go down, especially if it shows up around a resistance level.
A bearish pin bar and a shooting star are similar in that they both have lengthy upper wicks and small bodies. There is a distinction in how they are traded: a shooting star is a specific bearish reversal pattern, while a pin bar is a more general word for price action.
Not always. A pin bar at a critical support or resistance level could suggest that the trend is about to change. On the other side, if it happens in the middle of a trend and you don’t know anything else, it could just be a temporary break.
Higher timeframes like 4-hour and daily charts work best for bearish pin bars. They give stronger, more reliable signals compared to shorter timeframes, which often have more “noise” and false patterns.
A pin bar can be bullish or bearish, depending on where it is and how it looks. A bullish sign is a long lower wick with a small top body. A bearish sign is a long upper wick with a little bottom body.