If you have ever looked at candlestick charts, you may have noticed that some candles seem to stand out, as if they are giving you a tale about what recently transpired in the market. The Bullish Pin Bar is one of the most powerful ones.
If you know this pattern, it can transform the game. It’s simple to spot, easy to learn, and packed with useful information about market sentiment.
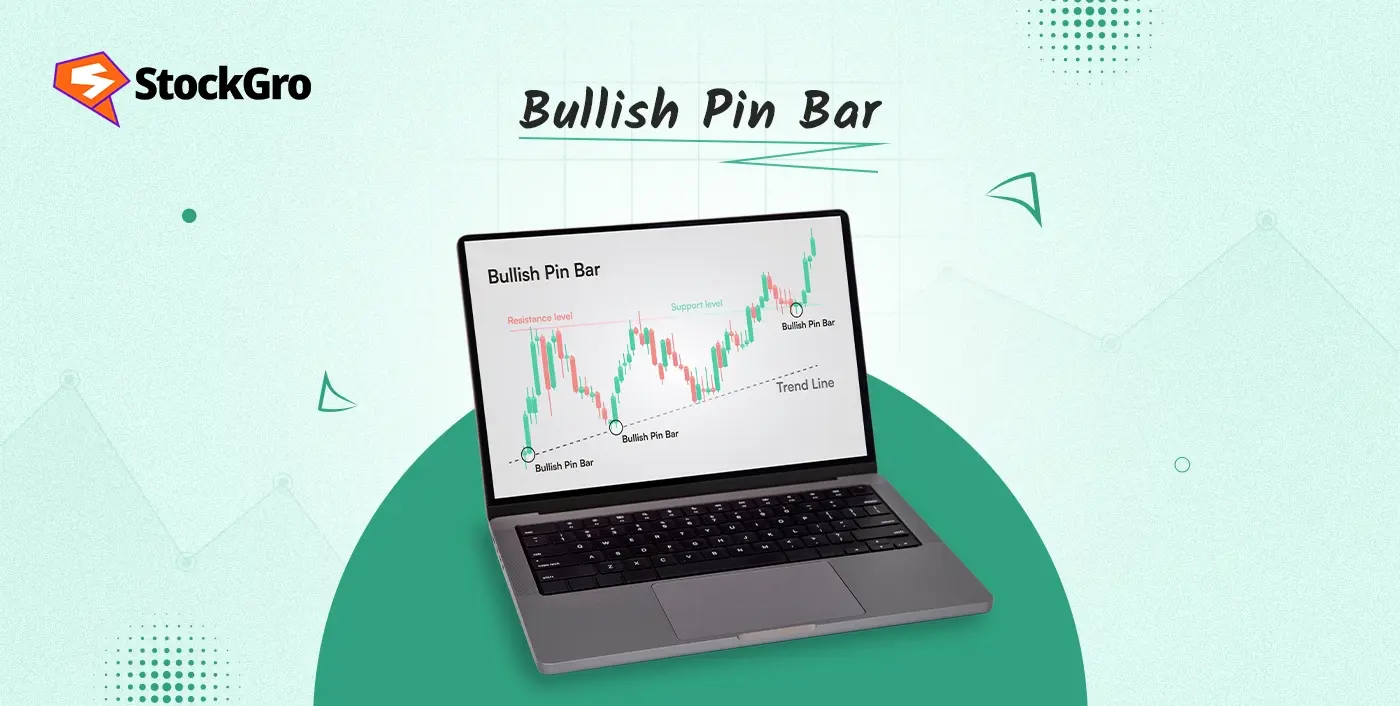
What is a Bullish Pin Bar?
In trading, some candles tell a bigger story than others. The Bullish Pin Bar is one such candle. It’s a single‑bar pattern that can act as an early heads‑up for price reversals from a downtrend to an uptrend. In Price Action Trading, traders like it because it clearly illustrates that prices won’t go down, with buyers jumping in quickly after sellers tried to push the market down.
You could say that the market is saying, “The lows didn’t hold, and buyers are here in force.” A bullish pin bar can be a strong sign that momentum is turning in favor of the bulls when it is in the proper place on the chart.
How to Identify a Bullish Pin Bar
If you know what candlestick pattern to look for, it is easy to find one:
- Long lower wick (shadow): at least twice the size of the candle’s body, showing strong rejection of lower prices.
- Small real body: positioned near the top of the candle’s range, indicating that prices closed close to the high of the period.
- Little or no upper wick: confirming that buyers maintained pressure through to the close.
On a candlestick chart, it looks like a candle with a long “tail” pointing downward and a small block at the top. It can be green or even red, the colour matters less than the height of the lower wick and where the body closes.
Psychology Behind the Bullish Pin Bar Pattern
Each candlestick shows a small fight between buyers and sellers.
A bullish pin bar forms when sellers seem to have the upper hand and push prices down, but there is a lot of buying pressure. Halfway through the candle’s development, buyers start to take in all the selling and push prices back up, sometimes by a lot. By the close of that period, the market is near its high, leaving behind a long lower shadow.
This tells traders two things:
- The market rejected lower prices.
- Buyer strength entering the market could lead to further upside.
It is a subtle, visual shift in sentiment that can help you get in ahead of bigger moves.
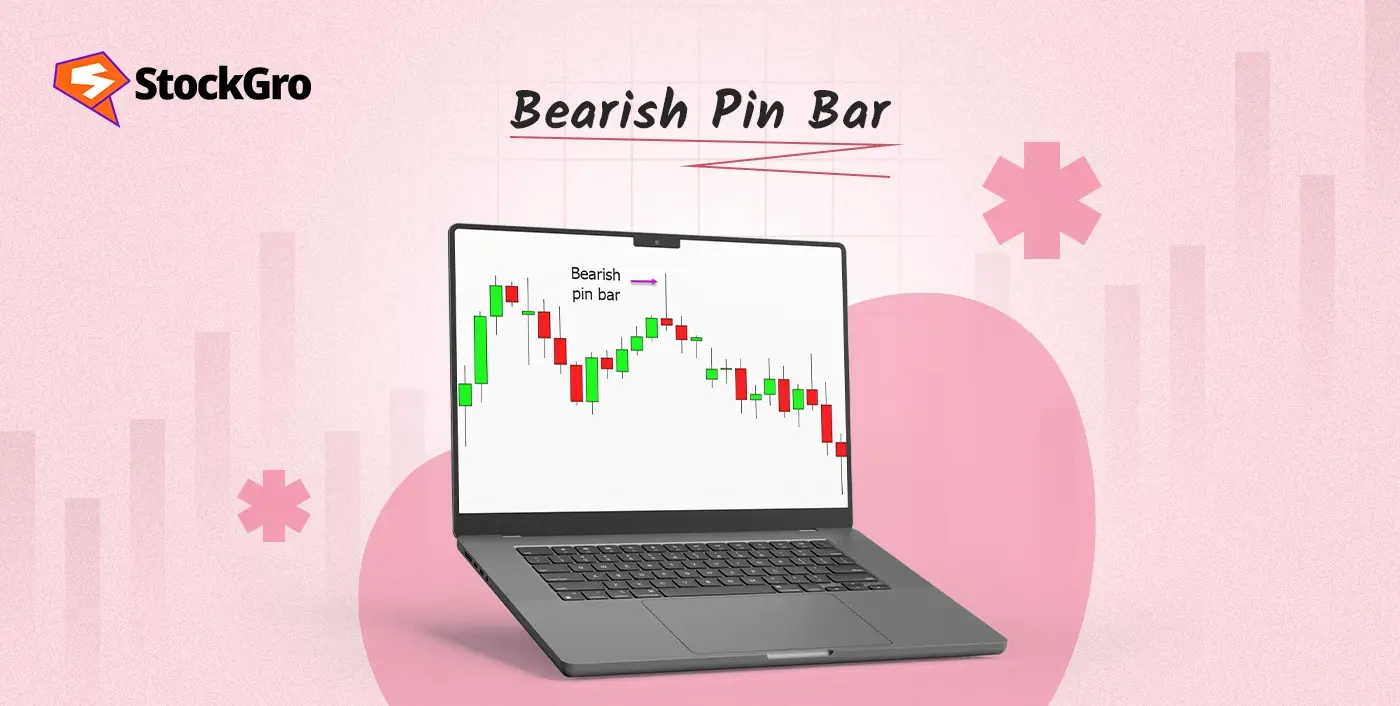
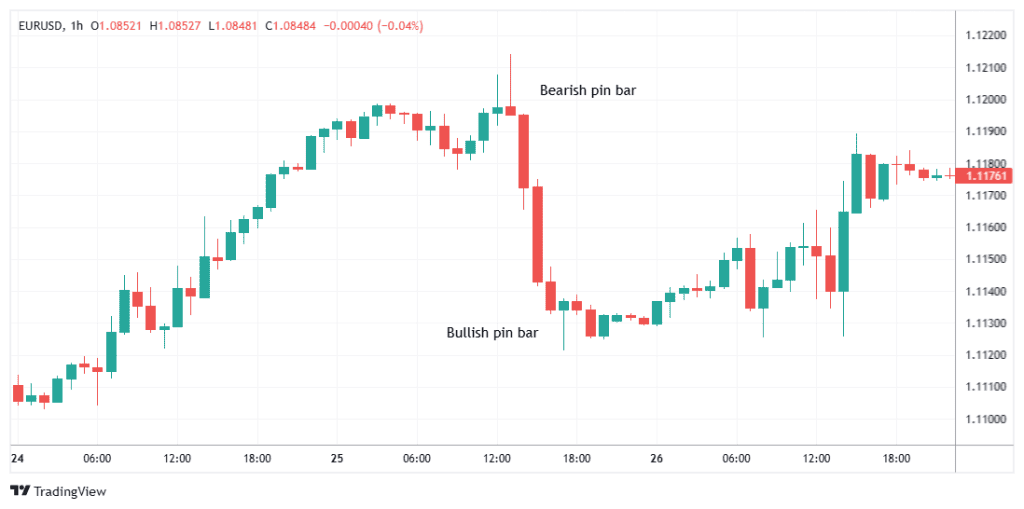
Bullish Pin Bar vs Bearish Pin Bar
| Feature | Bullish Pin Bar | Bearish Pin Bar |
| Wick | Long lower wick (rejection of lows) | Long upper wick (rejection of highs) |
| Body position | Near the top of the range | Near the bottom of the range |
| Signals | Buyer strength, potential uptrend | Seller strength, potential downtrend |
| Ideal location | Support, oversold zones, trend pullbacks | Resistance, overbought zones, trend pullbacks |
How to Trade a Bullish Pin Bar
The bullish pin bar works best when traded with market context, not in isolation. Here’s a plan that you can follow:
- Identify Context: Check to see if the pin bar is a crucial support level, a previous swing low, a trendline, or a Fibonacci level. These spots make the pattern more reliable.
- Plan Entry: Place a buy order slightly above the high of the bullish pin bar. This means you only enter if the price actually moves in the bullish direction.
- Set Stop Loss: Set it just below the low of the wick. This protects the trade in case the market invalidates the pattern.
- Take Profit: Target the next resistance level or use a fixed risk‑to‑reward such as 1:2, according to which if you risk ₹500 per share, aim for ₹1,000 per share in profit.
Example:
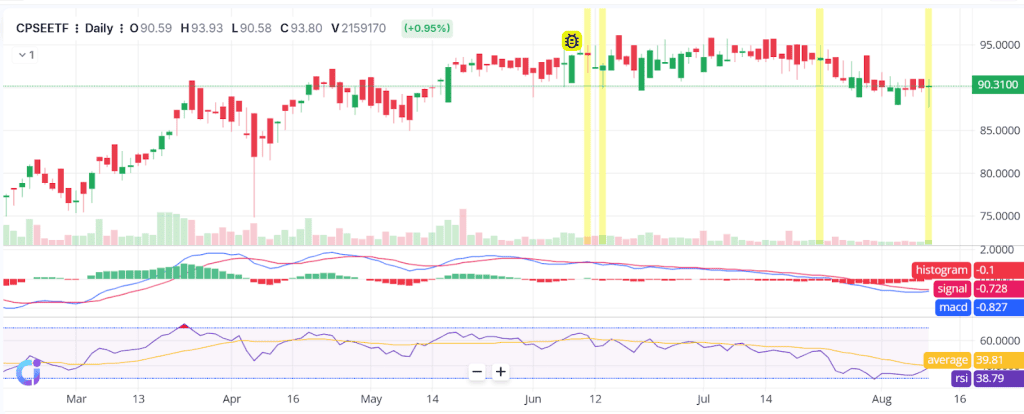
On 13 June, the chart (CPSEETF, Daily) showed a textbook bullish pin bar. Sellers pushed the price down sharply during the session, but buyers stepped in with strong momentum. By the close, the candle had a long lower wick, a small body near the top, and almost no upper shadow, signalling clear rejection of lower prices.
If you were trading it:
- Buy Entry: Set just above the high of the 13 June candle, so the trade triggers only if bullish momentum continues.
- Stop Loss: Placed a few points below the candle’s low to protect against a false breakout.
- Target: The next visible resistance from previous chart structure, locking in profit as price moved higher.
In the sessions that followed, the market moved upward, validating the bullish pin bar’s signal. This example shows how, when combined with a logical entry and good risk management, a single candle can set up a clean, high‑probability trade.
Best Timeframes & Markets to Use It
The 15-minute and hourly charts have more indications, but they also have more noise, which can make false pin bar setups when prices move swiftly during the day. Charts with longer durations, such as 4-hour, daily, or weekly charts, get rid of this noise and show stronger, more stable patterns that are linked to key support or reversal zones.
A lot of traders employ both: higher timeframes to see the big picture trend and shorter timeframes to get the best entry and exit points. This manner, you receive the accuracy of small charts while preserving the confidence and context of the bigger ones. This gives you both accuracy and a clear overall market trend.
The bullish pin bar can also operate in diverse markets, but it works best when price changes are evident and there is a lot of liquidity. In equities, the pattern often appears near support zones, offering clean setups. Forex markets provide reliable pin bars thanks to consistent price flow and high liquidity.
In cryptocurrencies, strong reversals can follow pin bars, but confirm with volume or trend context due to volatility. Commodities and index futures also respond well, especially around major supply or demand levels. To gain a better view of the market, always look at the signal along with the wider trend and crucial support and resistance levels.
Tips for Success:
- Always check the overall trend and the key support and resistance levels to be more accurate.
- To cut down on noise, check lower-timeframe pin bars against higher-timeframe trends.
- Avoid illiquid, choppy markets where patterns may be unreliable.
- To make confirmation stronger, use it with other tools like volume, momentum oscillators, or moving averages.
Common Mistakes When Trading Pin Bars
- Ignoring context: A bullish pin bar in the middle of a choppy market is less meaningful than one at a strong support level.
- No confirmation: Entering without waiting for a break above the pin bar high can lead to false starts.
- Overtrading small timeframes: Lower timeframe noise can produce many fake pin bars.
- Poor risk management: Not placing proper stops or targets increases losses.
Conclusion
The Bullish Pin Bar is a straightforward yet highly effective candlestick pattern for spotting shifts in market sentiment. It tells you when buyers have stepped in to defend a level and could be setting the stage for higher prices.
Putting bullish pin bars next to important support zones, confirmation signals, and good risk management can make a major impact. You’ll learn to spot them right away with practice, and that skill could help you enter into trades faster, with more confidence, and with a clear plan.
FAQs
A pin bar can be bullish or bearish. A bullish pin bar has a long lower wick, showing buyers are strong. A bearish pin bar has a long upper wick, showing sellers are in control.
The success rate of a pin bar strategy depends on market conditions, timeframe, and confirmation tools. When traded with strong support or resistance and proper risk management, many traders find it can work well more often than not.
Yes, pin bars work well in Forex. They show changes in market sentiment and can be used on currency pairs across different timeframes. Many traders combine them with trends, support, and resistance for more reliable setups.
Higher timeframes like the 4-hour and daily charts are best for pin bar trading. They filter out market noise and give more reliable signals compared to lower timeframes like 5 or 15 minutes.
Yes, a bullish pin bar can be red. The colour only shows if the candle closed lower than it opened. What matters more is the long lower wick and small body near the top, showing buyer strength.