
A recent SPIVA India report revealed that around 68% of large-cap actively managed mutual funds fail to beat their benchmarks over a 10-year period, proving how tough it is to consistently outperform the market.
Understanding this performance difference requires more than just looking at the returns, knowing what is alpha and beta in mutual fund investing is equally essential. Alpha tells you if a fund earned more than its benchmark while beta shows how much it reacts to market ups and downs. In this blog, we explain these two key measures and their importance.
What is Alpha and Beta in Mutual Fund?
Investors need more than just raw returns to judge a mutual fund’s performance accurately. Alpha and beta provide context by showing how well a fund manages risk and adds value compared with the market. These metrics help investors see not just how much a fund earned, but how efficiently it achieved those returns under different market conditions.
While alpha focuses on returns generated beyond expectations, beta helps understand risk. Together, these metrics help investors evaluate fund performance in terms of both risk and reward.
Understanding Alpha in Mutual Funds
Alpha represents a fund’s ability to generate returns beyond its benchmark. A positive alpha means the fund has outperformed expectations, while a negative alpha shows underperformance. It helps investors see if the fund manager’s strategy is adding value compared to a passive investment.
Understanding Beta in Mutual Funds
Beta measures how much a mutual fund’s price moves relative to the overall market. A beta of 1 means the fund moves with the market; above 1 shows bigger swings, while below 1 shows smaller swings. Beta helps in checking the risk level of a fund compared with market movements.
Alpha vs Beta: Key Differences
Alpha and beta are two important metrics used to evaluate mutual funds, each measuring different aspects of performance and risk. Let’s see how they differ:
| Feature | Alpha | Beta |
| Definition | Measures the fund’s returns beyond what is expected for its risk level | Measures the fund’s volatility or sensitivity compared to the market |
| Primary purpose | Analyses the value added by fund management | Assesses how much the fund may move with market swings |
| Main focus | Performance relative to benchmark | Risk and market responsiveness |
| How to interpret | Positive alpha = fund performed better than expected; Negative alpha = underperformed | Beta =1: moves with market; Beta >1: more volatile; Beta <1: less volatile |
| Calculation period | Usually over a specific period, often 1–3 years | Continuous measure showing ongoing market sensitivity |
| Investor use | Helps identify skilled fund managers or active strategies | Helps investors match fund risk with personal risk preference |
| Required data | Fund returns, market returns, risk-free rate | Fund returns and market returns |
| Risk involved | Shows risk-adjusted return | Shows potential exposure to market swings |
How to Calculate Alpha and Beta
Now that we know the basics of what is alpha and beta in mutual fund. Let’s take an example to understand the calculation of alpha and beta better.
Alpha Calculation
Alpha is the extra return a fund makes above its expected return, given its risk (Beta). The formula is:
Alpha = (Fund Return − Risk-Free Rate) − Beta × (Market Return − Risk-Free Rate)
Where:
- Fund Return = Return of the mutual fund
- Risk-Free Rate = Return on a risk-free investment, e.g., government bonds
- Beta = Beta of the fund
- Market Return = Return of the benchmark market index
Now for example, assume:
- Fund return = 12%
- Risk-free rate = 4%
- Market return = 10%
- Beta = 1.2
Alpha = (12% − 4%) − 1.2 × (10% − 4%)
Alpha = 8% − 7.2% = 0.8%
A positive alpha of 0.8% shows the fund earned slightly more than expected given its risk.
Beta Calculation
Beta measures how much a fund’s returns move when the market moves. The formula is:
Beta = Covariance (Fund Returns, Market Returns) ÷ Variance(Market Returns)
Where:
- Covariance(Fund Returns, Market Returns) = How fund and market returns move together
- Variance(Market Returns) = Variability of market returns
Say a fund’s monthly returns and market returns over 6 months are:
| Month | Fund return | Market return |
| 1 | 2% | 1.5% |
| 2 | 3% | 2% |
| 3 | -1% | -0.5% |
| 4 | 4% | 3% |
| 5 | 2% | 1% |
| 6 | 3% | 2.5% |
After calculating covariance and variance, Beta comes to = 1.1, meaning the fund is slightly more volatile than the market; if the market moves 1%, the fund typically moves 1.1%.
Why Alpha and Beta Matter to Investors
Evaluating mutual funds involves more than looking at returns, parameters like alpha and beta explain how performance and risk balance out, as follows:
- Guides tactical adjustments
Changes in either metric can signal when a fund’s approach or market alignment is changing, allowing investors to make timely adjustments without waiting for returns alone.
- Predict market or sector impacts
By observing beta in combination with alpha, investors can identify which funds may be more affected by sector rotations, policy changes, or economic events, helping them plan for potential market-wide effects.
- Aligning risk with investment goals
By combining alpha and beta, investors can see whether a fund not only delivers returns but also fits their comfort with risk. A low beta with positive alpha, for instance, may suit those seeking stability with modest outperformance.
- Assessing fund manager effectiveness
Alpha reveals how well a fund manager converts strategy into tangible results. It helps distinguish between skill-driven outperformance and gains that simply follow broader market trends.
- Building a balanced portfolio view
Looking at both alpha and beta together offers a full picture of potential returns and market exposure. This dual view helps in comparing funds fairly and in understanding their contribution to overall portfolio balance.
Practical Examples (with CAPM)
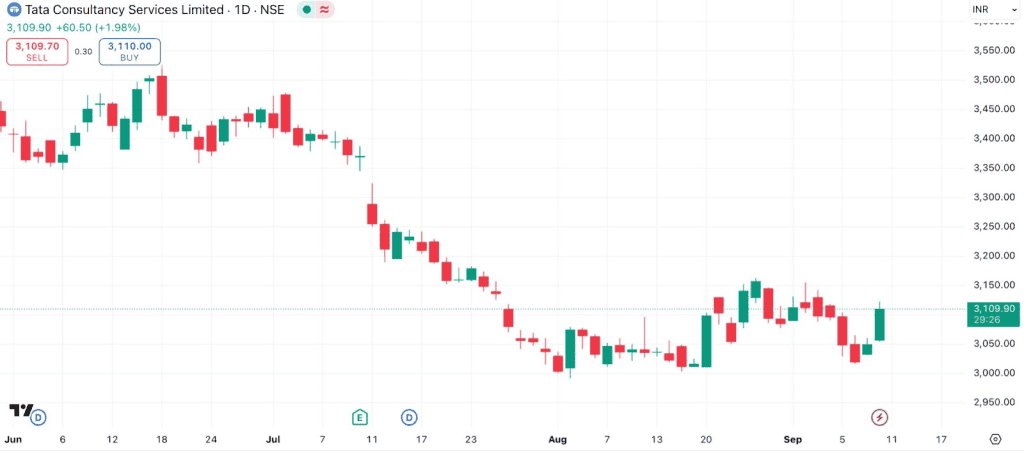
To see how beta and alpha work in practice, let’s look at Tata Consultancy Services (TCS). As of September 10, 2025, TCS trades at around ₹3,109.90, as shown in the chart above. Let’s assume its actual return over the past year was 14%.
To check if this return matches the risk taken, we turn to the Capital Asset Pricing Model (CAPM), which links expected return to a stock’s risk (Beta), the risk-free rate, and market return.
For this, we use the following assumptions:
- Beta (β): 0.65
- Risk-Free Rate (Rf): 6.5%
- Market Return (Rm): 12%
Step 1: Expected Return
Expected Return = Rf + β × (Rm – Rf)
= 6.5% + 0.65 × (12% – 6.5%)
= 10.08%
Step 2: Alpha (Excess Return)
Alpha = Actual Return – Expected Return
= 14% – 10.08%
= +3.92%
This shows TCS delivered more than expected for its risk level, generating positive alpha.
Limitations & Considerations
While alpha and beta are widely used, they have important limitations that require investors should be aware of:
- Past performance may not persist
Alpha only measures excess return in hindsight. In 2022, most actively managed large-cap mutual funds underperformed their benchmarks with 88% failing to beat the S&P BSE 100 TRI, proving Alpha is not a forward-looking guarantee.
- Alpha may reflect luck, not skill
A fund may show positive Alpha due to short-term sector bets rather than consistent management skill. When the market cycles changed, many funds lost that lead, showcasing alpha can evaporate when conditions shift.
- Beta overlooks external shocks
Beta assumes a stable relationship between a fund and its benchmark, but external shocks like geopolitical events or sudden policy changes can break this link. In such cases, Beta may understate the true risk exposure.
- Low beta does not eliminate losses
A fund labeled as “low beta” might still suffer heavy losses if it’s concentrated in vulnerable sectors. In 2022, for example, IT sector funds, many of which would appear steady based on beta, declined by around 18%, despite their low beta label.
- Overreliance misses broader factor
Depending solely on alpha and beta narrows the analysis to performance and volatility. Other key elements such as fund expenses, sectoral allocation, interest rate cycles, and economic policy shifts remain unaccounted for, which can lead to incomplete evaluation of risk and returns.
Related Metrics (Sharpe, R-squared, Treynor)
Along with alpha and beta, some other measures help in judging mutual fund performance and risk. These include:
- Sharpe ratio
The Sharpe ratio shows how much extra return a fund gives compared to a risk-free option, after considering ups and downs in returns. A higher value means the fund is rewarding investors better for the risks involved. For example, a fund with a 1.5 Sharpe ratio is typically stronger than one with 0.8.
- R-squared
R-squared shows how closely a fund’s returns move in line with its benchmark index. A value near 100 means the fund mostly follows the market, while lower values mean the fund has more independent movement. For instance, an equity fund with an R-squared of 90% mirrors the market closely, while one with 60% shows greater independence.
- Treynor ratio
The treynor ratio shows how well a fund rewards you for taking market-related risk. It focuses on the ups and downs caused by the overall market, not the fund’s total swings. A higher ratio means the fund is giving stronger returns for the market risk taken.
Conclusion
When it comes to what is alpha and beta in mutual fund, think of them as your fund’s report card. Alpha tells you if it’s truly beating the curve, while beta shows how bumpy the ride is. Together, they separate hype from reality, helping you spot funds that win the numbers smartly.
FAQ‘s
A positive alpha shows the fund has outperformed its benchmark after adjusting for risk. It signals strong management and effective investment decisions, reflecting value added beyond what the market or index alone delivered.
Beta measures a fund’s sensitivity to overall market movements. A beta above 1 means higher volatility than the market, while below 1 suggests less volatility. High-beta funds rise and fall more sharply, affecting risk and potential returns.
Yes, a fund can have high alpha and high beta, meaning it generates above-benchmark returns but with higher risk or volatility than the market. Such outperformance often comes with increased fluctuations in returns.
Alpha is the difference between a fund’s actual return and the return expected based on its risk, measured by beta, using the Capital Asset Pricing Model (CAPM). The formula is:
Alpha = (Fund Return − Risk-Free Rate) − Beta × (Market Return − Risk-Free Rate)
It shows if the fund outperformed or underperformed risk-adjusted expectations.
Jensen’s alpha uses the CAPM model to measure a portfolio’s risk-adjusted excess return over its expected return. A positive Jensen’s alpha means outperformance given the portfolio’s beta, providing a benchmark for manager skill.
Alpha measures outperformance vs. a benchmark, beta shows sensitivity to market moves. The Sharpe ratio compares returns to total risk, while R-squared indicates how closely fund returns mirror the benchmark. Each metric offers a unique perspective on risk and performance.
Both metrics matter. Alpha shows if a manager adds value beyond the benchmark, while beta reveals risk relative to the market. Investors often seek consistently positive alpha with beta matching their risk tolerance for balanced fund selection.