India’s stock market has a long history of crashes. Each one left a mark on investors and the economy. The country’s retail investor participation in daily trading is increasing, with retail investors’ accounts crossing a milestone of 24 crores in November, 2025. As more Indians invest, understanding the history of market crashes becomes especially important.
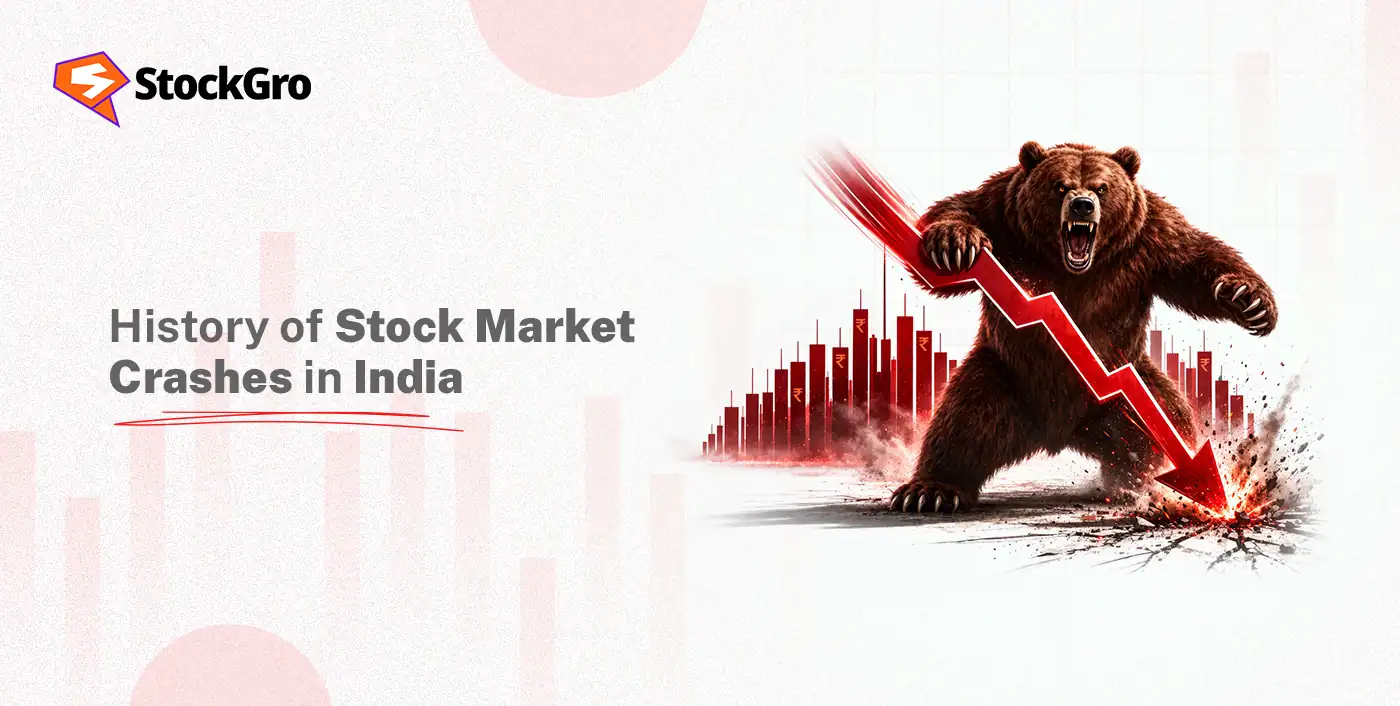
History of Stock Market Crashes in India
Stock markets are always fluctuating. That is their nature. Yet, some falls have been sharp enough to erase years of wealth in just days. India’s equity markets have seen many such moments. Some happened because of fraud. Some came from global events. Others were triggered by politics or war. Here is a comprehensive timeline of major stock market crashes in India, including the current crash in 2026.
May 1865- The First Stock Market Crash
Interestingly, the first stock market crash in India predates the Bombay Stock Exchange. Around 1865, both Gujarati and Parsi traders and brokers were engaged in stock trading in Mumbai.
The American Civil War commenced in 1861 and ended in 1865. At the start of the this war, cotton was a majorly exported product from India. As the war progressed, it disrupted the American cotton supply, thereby increasing the demand for Indian cotton sharply. Investors began trading heavily in cotton-related stocks, which led to soaring prices of these stocks.
Then, in April 1865, when the war came to an end, American cotton was back in the market again. Consequently, Indian cotton prices collapsed overnight. Stocks crashed, leading to heavy investor losses. It was India’s first painful lesson about how global events can sweep into local markets.
1982- Friends of Reliance
At that time in 1982, bear cartels were a common force on Dalal Street. These were groups of wealthy traders who would collectively target a particular stock. Their method was simple. They would short-sell large quantities of any stock. This meant they sold shares they did not actually own, betting that prices would fall.
As prices dropped, they would buy those shares back at lower levels and pocket the difference. Retail investors caught in the middle would suffer the losses. In 1982, a bear cartel in Bengal began short-selling Reliance Industries shares. Around 11 lakh shares were short-sold. The stock price fell from ₹131 to ₹121.
Dhirubhai Ambani instead mobilised a group of friendly brokers who bought back Reliance shares in large quantities. This pushed prices back up and cornered the bear cartel. While Dhirubhai saved Reliance, the incident showed how easily bear cartels could manipulate prices and damage retail investors.
April 1992- Harshad Mehta Scam
One of the largest scams in the Indian stock market was observed in 1992. The man behind the scam was Harshad Mehta, a stockbroker who earned the nickname ‘Big Bull’. He siphoned over ₹5,000 crore from banks using fake bank receipts. This amount was then used to artificially hike stock prices.
His most famous move was pumping up ‘ACC Limited shares’ from ₹200 to ₹9,000 per share within months. When journalist Sucheta Dalal revealed the scam in The Times of India on April 23, 1992, everything collapsed.
On April 28, 1992, the BSE fell 12.77% in a single session. The Sensex went from a peak of 4,467 to around 2,529 in the months that followed. Investors lost billions. A two-year bear market followed. SEBI was strengthened as a result of this crash. The Sensex did not consistently surpass the 4,000 level again until 1999.
2000 – Dot-Com Bubble Burst
The late 1990s were electric for technology stocks around the world. The internet was new, exciting, and nobody fully understood what it could or could not do. That uncertainty worked in favour of wild optimism. Companies with “.com” in their name were getting funded even without a real business model. Valuations were built on promises, not profits.
India was not immune to this fever. Domestic IT companies saw their stock prices rise sharply. Infosys, Wipro, and Satyam became household names. The Sensex, which had been crawling in the low thousands for years, suddenly started climbing. Investors who had never invested in equities before started opening accounts. The mood was that the internet would change everything and that getting in early was the only thing that mattered. Broker Ketan Parekh added to the damage.
Ketan Parekh was a stockbroker from Ahmedabad who had built a reputation as someone with an extraordinary ability to pick winning stocks. He identified a set of ten stocks, mostly in the IT, media, and communication sectors. These came to be called the K-10 stocks. He borrowed heavily from cooperative banks and used that money to buy large quantities of these stocks. As he kept buying, the prices kept rising. Other investors followed, assuming he knew something they did not. The Sensex fell from 4,200 levels to around 2,594 in 2001. Many retail investors who had entered during the IT boom lost significant savings.
The dot-com crash in India damaged the investors’ sentiment in a dual fold manner. The global bubble burst wiped out IT valuations. Ketan Parekh’s collapse then wiped out whatever remaining confidence was left. It took India’s markets years to regain momentum from this combined blow.
March 2008 – US Financial Crisis
The 2008 financial crisis had its roots in the US mortgage market, where banks had been issuing home loans to borrowers with negligible repayment abilities. The cash flows from these loans were repackaged into complex yet low-risk financial instruments and sold to institutional investors globally. When US real estate prices started falling in 2007, default rates climbed. The value of those instruments fell sharply. Banks holding them on their balance sheets faced immediate losses.
In September 2008, Lehman Brothers went bankrupt- the largest setback in US history at the time. Credit markets seized globally. Trade financing dried up. Institutions worldwide scrambled to raise liquidity.
Foreign investors holding Indian equities sold their positions to cover losses elsewhere. India had no direct exposure to subprime mortgage products, but that offered no protection against the outflows. On January 21, 2008, the Sensex fell 1,408 points in a single session. The day was marked as Black Monday. The index had stood at 20,465 at the start of 2008. By year-end, it had fallen to approximately 9,716 — a decline of over 50% in twelve months. Full recovery to the 20,000 level did not come until September 2010.
November 2016 – Demonetisation and US Election Trends
On November 8, 2016, the Indian government went ahead with its currency demonetisation. ₹500 and ₹1,000 currency notes were announced invalid with immediate effect. Nearly 86% of all cash in circulation was withdrawn from the system overnight.
The economic disruption was immediate and wide. Cash-dependent sectors, including real estate, agriculture, and small retail trade, came to a near standstill. Consumer spending dropped sharply. Corporate earnings projections for the quarter were revised downward across industries. Markets began falling as investors struggled to assess the depth of the economic slowdown.
On the same night, Donald Trump won the US Presidential election. This outcome was unexpected across financial markets. A Trump victory raised concerns about US trade policy tightening, a stronger dollar, and rising American interest rates. Each of these factors makes emerging markets like India less attractive for foreign capital.
FIIs responded by selling Indian equities. The Sensex declined roughly 6% in the weeks following these two events. The simultaneous arrival of a domestic policy shock and a global political surprise within hours of each other made November 2016 an unusually difficult period for Indian markets.
June 2015 to June 2016 – Yuan Devaluation and Brexit
In August 2015, China’s central bank cut the Yuan’s value by approximately 2%. China is the world’s largest commodity consumer and a significant driver of global trade. A deliberate currency devaluation pointed to economic stress that official data had not fully reflected. Commodity prices fell across the board. Capital moved out of emerging markets. On August 24, 2015, the Sensex lost 1,624 points in a single session. A below-average monsoon and weak corporate earnings in India added to the pressure through the remaining months of 2015.
In June 2016, the United Kingdom voted to exit the European Union. The result went against the expectations of most market participants. It created immediate uncertainty around European trade arrangements and the broader global economic outlook. Emerging markets, including India, saw a fresh round of FII outflows.
Over these twelve months, Indian markets lost approximately ₹7 lakh crore in paper wealth. By February 2016, the Sensex had declined close to 26% from its earlier highs. The causes were almost entirely external. India’s domestic fundamentals were a secondary factor throughout.
March 2020 – COVID
The COVID-19 market crash was the fastest and sharpest India had ever seen. What typically unfolds over months happened in a matter of weeks. By early March 2020, COVID-19 had spread across Europe and the United States at a pace that governments were struggling to manage. The WHO declared a global pandemic. Lockdowns were announced across multiple countries. India imposed a nationwide shutdown from March 25, 2020.
On March 23, two days before the lockdown, Indian markets recorded their steepest single-session fall. The Sensex dropped 3,934 points, a decline of 13.15%. The Nifty 50 fell 1,135 points. Circuit breakers were triggered mid-session. ₹14 lakh crore of investor wealth was wiped out before the closing bell.
From the January 2020 peak to the March low, the market had lost nearly 40% in roughly eight weeks. Certain sectors, such as aviation and hospitality, were not even operational. There was no clear timeline for when normal economic activity would resume.
Recovery came faster than most had expected. Central banks cut interest rates and released liquidity into financial systems. The Indian government rolled out fiscal support. Retail investor participation in domestic markets rose through the downturn, with demat account openings climbing sharply. By November 2020, the Sensex had returned to its pre-COVID levels. From the lowest point to full recovery, the market took approximately eight months- the shortest turnaround following any major crash in India’s history.
Currently 2026 – US-Iran War
Financial fraud destroys market confidence faster than almost any external event. When a large-scale scam surfaces, investors do not just sell stocks; they lose trust in the system itself. Rebuilding that takes considerably longer than recovering prices.
India’s equity markets are directly exposed to global capital flows through FII participation. When foreign investors exit in volume- whether due to a global crisis, rising US interest rates, or geopolitical risk- domestic buyers rarely absorb the selling fast enough. Prices fall sharply and quickly.
Understand how the US–Iran war is impacted.
Political and policy surprises generate uncertainty. Unexpected election results, overnight regulatory changes, or military conflicts that markets had not priced in all carry the same effect- investors cannot assess near-term outcomes, so they reduce exposure.
Crude oil represents India’s most concentrated commodity risk. A sharp price increase raises inflation, widens the trade deficit, weakens the rupee, and compresses corporate margins. Few other variables hit the economy from this many directions at once.
Calling the precise timing of a crash in advance is not possible. However, markets running at stretched valuations, with high systemic leverage and an unstable global backdrop, have consistently proven more vulnerable. These conditions do not predict a crash, but they do indicate reduced room for error.
Common Reasons for Stock Market Crashes
Stock market crashes are not predictively dependent on any single factor. However, some main reasons that have collectively formed the basis of stock market crashes in history are:
- Financial scams involving the manipulation of prices have caused some of the worst crashes. When fraud is exposed, confidence vanishes overnight.
- Global events like wars, financial crises, and pandemics spread panic across borders quickly. India’s deep integration with global markets means it absorbs global shocks fast.
- Political surprises such as unexpected election results or sudden policy changes can trigger sharp sell-offs.
- FII selling is a major driver of sharp market falls. When foreign investors pull out in large volumes, markets drop quickly.
- Commodity price shocks, especially in crude oil, create inflation fears. This leads investors to exit equities rapidly.
Predicting stock market crashes is nearly impossible. However, watching for overvalued markets, excessive leverage, and rising global tensions can give early warning signals.
Final Thoughts
Every crash in this list felt permanent at the time it happened. None of them were. Markets recovered from the Harshad Mehta scam, from the 2008 global crisis, and even from the COVID collapse. The current stock market crash due to the US-Iran war is painful and ongoing. But history suggests it, too shall pass.
The real lesson from every crash is simple- selling in panic locks in losses. Those who stayed invested or bought during crashes were rewarded when markets bounced back.
FAQs
The COVID-19 crash on March 23, 2020, saw the Sensex fall 13.15% in one session. The 2008 financial crisis caused a 50% fall over 12 months.
Generally, a fall of 20% or more from recent highs is widely accepted as a bear market or crash. Smaller falls are called corrections.