Markets are rarely as clear as they seem. Price movements leave traders confused about the next step they should be taking. The Ichimoku Cloud cuts through that uncertainty by providing a holistic view of the market. If you want to trade with more clarity and less guesswork, this guide is for you.
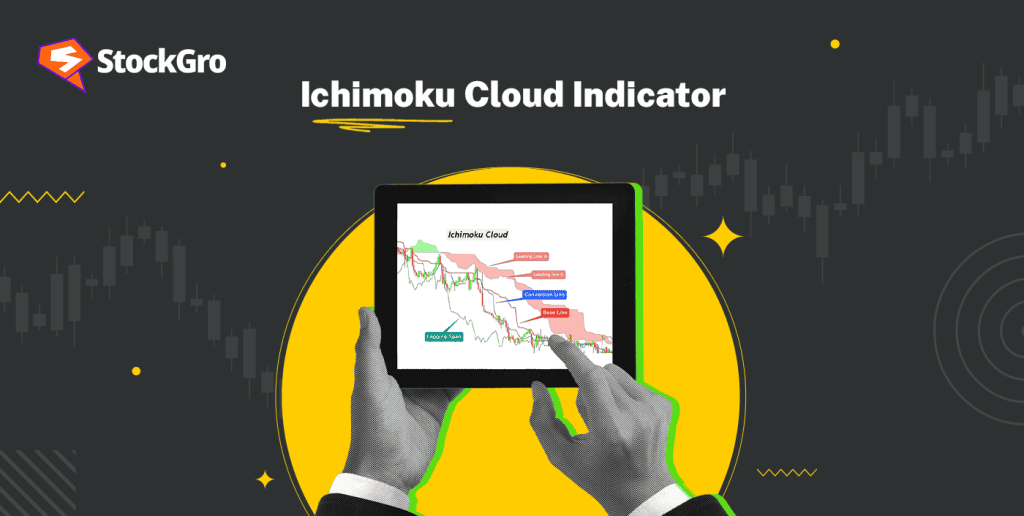
What is Ichimoku Cloud
The Ichimoku Cloud is a technical analysis indicator developed by Goichi Hosoda in the late 1960s. It is also called the ‘Ichimoku Kinko Hyo’ in Japanese, which translates to ‘one-glance equilibrium chart’. The idea behind it is simple: a trader should not have to use multiple tools. He can understand the overall market condition with one simple look.
Unlike other indicators that focus only on price or momentum, the Ichimoku Cloud combines multiple elements into one system to show the trend direction, momentum strength, support and resistance levels, and potential reversals.
Components of the Ichimoku Cloud
The Ichimoku Cloud consists of five main components. Each line serves a specific purpose.
- Tenkan Sen: This line measures the short-term momentum by finding the average of the highest high and the lowest low over nine periods. It is also called the conversion line.
- Kijun Sen: Also known as the base line, the Kijun Sen finds the midpoint of the highest high and lowest low in a 26-day period. It reflects the medium term trend.
- Senkou Span A: This is one boundary of the cloud. It is the average of the Tenkan-sen and Kijun-sen, projected for the next 26 days. It helps in determining the future support and resistance levels.
- Senkou Span B: It is calculated with the highest high and lowest low over the past 52 periods, projected 26 periods ahead. It is used to find the next support and resistance level and serves as the cloud’s second boundary.
- Chikou Span: The Chikou span helps in confirming the strength of a trend. It is plotted for 26 periods back, and that is why it is called the lagging line.
Calculation of Ichimoku Cloud Indicator
The Ichimoku Cloud may look complex, but its calculation follows clear rules. The components are calculated with the following formulae:
Tenkan sen = (9-Period High + 9-Period Low) / 2
Kijun sen = (26-Period High + 26-Period Low) / 2
Senkou Span A = (Tenkan sen + Kijun sen) / 2
Senkou Span B = (52-Period High + 52-Period Low) / 2
Chikou Span = Current closing price plotted 26 periods back
Example
Suppose in the last 9 days, the highest price was ₹148 and the lowest was ₹132.
Tenkan sen = (148 + 132) / 2 = ₹140
Now, assume over the last 26 days, the highest price was ₹165 and the lowest was ₹120.
Kijun sen = (165 + 120) / 2 = ₹142.5
Senkou Span A = (140 + 142.5) / 2 = ₹141.25
If over the last 52 days, the highest price was ₹190 and the lowest was ₹110,
Senkou Span B = (190 + 110) / 2 = ₹150
Trend Identification of the Ichimoku Cloud Indicator
The Ichimoku Cloud makes trend identification easier by combining multiple signals into one clear visual system.
- Price and Cloud Position: When the price is below the cloud, it means the trend is bearish, but if the price is above the cloud, it signals a bullish trend. Neutral phases are marked by prices inside the cloud.
- Cloud Colour and Thickness: A green cloud indicates an uptrend, while a red one signals a downtrend. A thick cloud means stronger support or resistance and higher participation.
- Chikou Span Confirmation: If the Chikou Span is above the past price, the trend is upward. On the other hand, when the Chikou Span is below the previous price, it points to a downward trend.
- Tenkan Sen and Kijun Sen Cross: A bullish crossover occurs when the Tenkan-sen cuts above the Kijun-sen. If the Tenkan-sen is cutting below the Kijun-sen, the crossover is said to be bearish.
Interpretation of the Ichimoku Cloud Indicator
Let’s understand how to interpret the Ichimoku Cloud with a practical, real-life example of the Nifty 50 movement from January 2026 to February 2026.
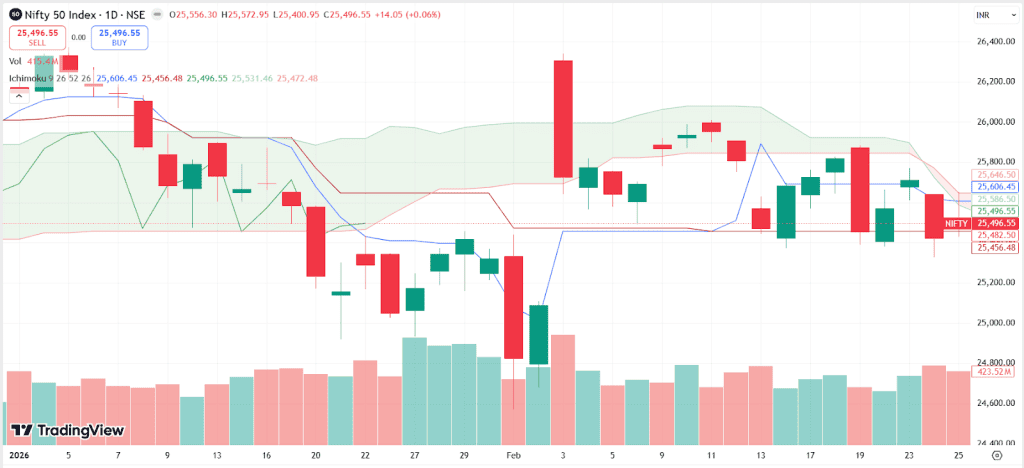
- In early January, Nifty was trading close to 26,200 and was positioned above the cloud. The Tenkan-sen was also above the Kijun-sen, confirming the short-term bullish momentum.
- By mid-January, the Nifty had dropped to 25,700. The Tenkan-sen also crossed below the Kijun-sen, adding to the bearish sentiment.
- As January ended, the Tenkan-sen dropped below the Ichimoku cloud. The Nifty also dropped to 25,200, confirming the downward trend.
- February started with a sharp rebound. After a few sessions, the Nifty has climbed up to 25,800, shifting inside the cloud again.
- The Tenkan-Sen also followed this momentum, rising back to reach inside the Ichimoku cloud by February 13, 2026, suggesting the buyers were regaining control, and upward movement would continue.
- However, this move failed to sustain. The Nifty plunged to around 25,500 by late February. The Senkou Span and B have a narrow gap, and the Tenkan is just about to fall below the cloud again, signalling a low volatility consolidation phase.
Usage of Ichimoku Cloud Strategy for Trading
The Ichimoku Cloud can be used as a complete trading framework rather than a standalone signal.
1. Trend Following Strategy
This strategy involves trading in the direction of the prevailing market trend. Ichimoku makes the trend identification simpler based on where the price lies in relation to the cloud.
If the price stays above the cloud, the momentum is bullish, and if the price stays below the cloud, the momentum is turning bearish. The cloud helps in aligning the trade with the broader market trend.
2. Crossover Strategy
The interaction of Tenkan-sen and Kijun-sen can also be used for trading. When the Tenkan-sen crosses above the Kijun-sen, it signals increasing short-term momentum. When it crosses below, it signals weakness in the current trend.
Ichimoku adds context by helping traders judge whether the crossover supports the larger trend or goes against it.
3. Support and Resistance
Unlike fixed levels, the Ichimoku cloud acts as a dynamic indicator that adjusts with the price movement. In an uptrend, the cloud becomes a support zone, and during a downtrend, the cloud serves as the resistance level.
It is useful for identifying potential entry and exit zones rather than just chasing the price move.
4. Breakout Strategy
This strategy is focused on using a breakout to trade. It marks the beginning of a stronger directional move, and positions are taken to match it.
When the price stays inside the cloud, it means the market is in balance. A breakout happens when the price moves out of the cloud after long consolidation periods. The Ichimoku confirms whether the momentum is sustainable or not.
Limitations
While powerful, the Ichimoku Cloud is not perfect. It has the following limitations:
- False Signals: It can produce whipsaws in non-tending or choppy markets when the price keeps moving above or below the cloud without any clear direction.
- Lagging Indicator: As the Ichimoku uses past data, the signals may appear after the trend has passed or reversed, which can become a trap.
- Not Ideal for Short-Term: The indicator is designed for a medium to long horizon. It may respond slowly to price changes, making it less effective for intraday trading or scalping.
- High Complexity: The five distinct lines can clutter the chart, making it difficult for beginners to interpret the indicator. Lapses or differences in representation can create inconsistency in trading decisions.
Conclusion
The Ichimoku Cloud offers a structured way to understand the broader market conditions, identify the trends, and spot key support and resistance levels. Like any other indicator, it has drawbacks owing to its lagging nature and tendency to create false signals in sideways markets.
Understanding its components, their calculation, and interpretation helps traders to move from confusion to clarity.
FAQ‘s
Yes, the Ichimoku Cloud is considered a reliable indicator because it combines trend direction, momentum, and support and resistance into one system. It works best in trending markets where the price shows sustained movement and a clear direction.
The accuracy of the Ichimoku indicator depends on market conditions and the timeframe. It performs better in strong trends and may give false signals in sideways markets. Using confirmation signals and proper risk management improves its efficiency.
The numbers 9, 26, and 52 are the standard periods used to calculate the Ichimoku lines. They define how far back price data is measured to determine short-term, medium-term, and long-term market movement.
To read the Ichimoku indicator, first check whether the price is above, below, or inside the cloud. Then observe Tenkan and Kijun crossovers, and confirm the trend strength using the Chikou Span.
There is no fixed success rate for Ichimoku. Its performance varies by asset and time horizon. It generally works better in trending markets when combined with risk management and technical confirmation.