The Indian banking industry is currently experiencing strong momentum, driven primarily by rising incomes, increased consumer demand, and easier access to credit. One of the most significant contributing trends is the usage of digital payment ways.
As of July 2024, a total of 602 banks were handling UPI, and this has made a major shift towards banking. During the period, the digital transactions went up to around 15.08 billion, and the overall transaction value of ₹2,10,000 crore.
Due to this, there are various banks which are benefiting, and Kotak Mahindra and IndusInd Bank stand out as two well-served companies. Thus, in this blog, let us compare Indusind Bank vs Kotak Mahindra Bank and look at their finances and figure out which is better.
Banking sector overview
In 2024, public sector banks held assets worth USD 1,861 billion, accounting for approximately 59.53% of total banking assets. Private sector banks had assets valued at USD 1,264 billion, while foreign banks contributed a slightly smaller share at USD 18 billion. Public sector banks remain dominant in the sector, but private banks are steadily narrowing the gap.
On the other hand, interest income showed a healthy trajectory within banking. Public sector banks’ growth generated USD 128 billion which was 57.23% of total interest income earned sector-wide. Foreign banks contributed USD 10 billion and private sector banks followed closely with USD 95.7 billion.
Also read: List of Top Software Production Stocks in India 2025
IndusInd Bank overview
IndusInd Bank Limited was incorporated in 1994 under the Banking Regulation Act 1949 as a new commercial banking entity. The bank provides diverse banking products and financial services besides undertaking various treasury operations for retail clients and corporate entities.
IndusInd Bank has an expansive nationwide network and shows its strong presence all over India. The bank reaches roughly 1.62 lakh villages and serves a customer base of over 41 million with 7174 outlets including 3081 branches, 3027 ATMs and 3796 BFIL branches (Bharat Financial Inclusion Limited)which is a financial services company that acts as a business correspondent for IndusInd Bank.
IndusInd Bank has a diversified loan portfolio largely split between consumer banking at 58% and corporate clients at 42% as of March 2025. Vehicle finance occupies a substantial 28% of the total loan book followed by non-vehicle retail loans at 21% and microfinance accounts for 9%.
Kotak Mahindra Bank
Kotak Mahindra Bank provides various financial services which consist of retail banking, treasury corporate, banking, investment banking, stock broking, vehicle finance, and advisory services along with asset management life insurance and general insurance products.
As of March 2025, this bank serves over 5.3 crore customers and operates 2148 bank branches with total group AUM valued quite highly at ₹6.7 lakh crore. The bank expands nationwide with a robust footprint across metros and rural areas committing to spread its financial inclusion everywhere slowly.
Also Read: Mahindra vs Ashok Leyland: Who’s leading the commercial vehicle market?
Financial performance
Now, let’s examine the full-year FY25 financial performance of both banks to determine whether IndusInd Bank or Kotak Mahindra Bank is performing better.
| Metrics (In ₹ Crore) | Indusind Bank Ltd | Kotak Mahindra Bank Ltd |
| Revenue | 26,721 | 39,760 |
| Net Interest Income | 19,031 | 28,342 |
| Net Interest Margin | 2.25% | 4.96% |
| Net Profit | 2,575 | 16,450 |
| Net Non-Performing Asset | 0.95% | 0.31% |
| Return on Asset | -1.74% | 2.21% |
| Total Assets | 5,54,107 | 6,93,624 |
| Deposit | 4,10,862 | 4,99,055 |
1. Revenue
Revenue is the total amount earned by banks in their operations, which includes interest, fees, AMC charges, etc. Higher revenue and stronger business are indicated. Kotak Mahindra Bank reported a revenue of ₹39,760 crore, while IndusInd Bank stood at ₹26,721 crore. Kotak Mahindra Bank leads under this metric due to a more robust operational scale and diversified income streams.
2. Net interest income
Net Interest Income reflects the bank’s earnings from its lending activities minus interest paid on deposits. A higher NII indicates stronger core banking performance. Kotak Mahindra posted ₹28,342 crore, whereas IndusInd Bank recorded ₹19,031 crore. Kotak Mahindra Bank takes the lead with better core interest-generating capacity and this is majorly due to favourable current account savings account (CASA) mix and lower cost of funds due to rate rationalization on savings and term deposits.
3. Net profit
Net profit is the last in-hand profit taken by the company once all the expenses, etc. are deducted. A higher net profit is better for the firm. Kotak Mahindra reported a higher ₹16,450 crore in net profit, significantly higher than IndusInd Bank’s ₹2,575 crore. This is majorly due to ₹2,730 crore gain from the divestment of Kotak General Insurance.
4. Net interest margin
Net interest margin is a metric which shows how effectively a bank earns interest compared to what it pays. A higher margin shows better efficiency. Kotak Mahindra Bank has shown a NIM of 4.96% against IndusInd Bank’s 2.25%. Under this metric too, Kotak Mahindra Bank leads.
5. Return on asset
Return on assets is a metric where banks make use of their total assets to generate profit. Usually, a higher ROA shows better use of resources. Kotak Mahindra gave 2.21%, while IndusInd Bank had a negative ROA of -1.74%, and this is majorly so due to losses in Q4. Here, Kotak Mahindra leads under this metric due to fewer delinquencies in the secured loan book and controlled provisioning.
6. Net NPA
Net NPA is the percentage of loans not repaid at the given time. A lower net NPA is better. Kotak Mahindra’s GNPA stood at 0.31%, and IndusInd Bank had a higher GNPA of 0.95%. Under this metric, Kotak Mahindra Bank leads as it maintains a high provision coverage ratio (PCR) of 78%.
7. Total assets
Total assets show the overall size of the bank’s balance sheet, and the higher the total assets, the better, as it shows the position in the market. Kotak Mahindra Bank reported ₹693,624 crore, while IndusInd Bank stood at ₹5,54,107 crore. Kotak Mahindra Bank leads with a higher asset base as Kotak’s diversified financial conglomerate model (banking, capital markets, AMC) supports a larger balance sheet.
8. Deposits
Deposits are the core funding source for a bank. Higher deposits are better, as they show customer trust and the bank’s position in markets to gather funds. Kotak Mahindra Bank posted ₹4,99,055 crore in deposits, compared to IndusInd Bank’s ₹4,10,862 crore.
Also Read: Prostarm Info Systems IPO 2025: Key dates & details
Stock market performance
IndusInd Bank is currently trading at a price of ₹790 as of 26 May 2025. Also, the bank has made a 52-week high and low of ₹1,550 and ₹605 respectively.

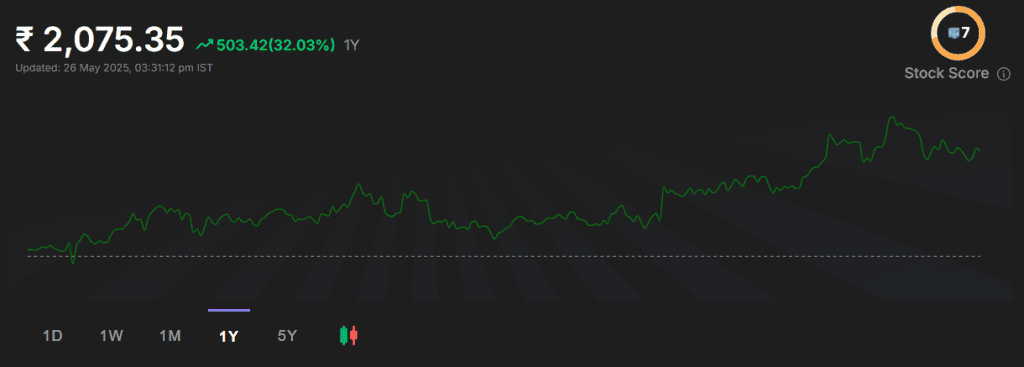
Kotak Mahindra Bank’s current market price is ₹2,080 as of 26 May 2025 and it has made a 52-week high and low of ₹2,302 and ₹136 respectively.
Let us have a look at the stock market performance of both banks as of 26 May 2025:
| Returns (As of 26 May 2025) | IndusInd Bank | Kotak Mahindra Bank |
| 1 Month | -0.50% | -4.45% |
| 6 Months | -19.85% | 18.61% |
| 1 Year | -44.51% | 22.65% |
| 5 Years | 129.78% | 81.17% |
In the past 1 year, stocks like Kotak Mahindra Bank led in performance, whereas over a longer horizon, IndusInd Bank has led with over 129.75% returns in the past 5 years.
Bottomline
Kotak Mahindra Bank & IndusInd Bank are both prominent players in India’s banking sector. In recent performance metrics, Kotak Mahindra Bank has reported higher revenue, profits, and stronger loan recovery. While IndusInd has shown solid long-term performance, its recent results appear comparatively lower.
These differences highlight varying short-term trends between the two banks. Investors may consider these factors as part of a broader evaluation of each bank’s financial trajectory.