Table of contents
The key factor for successful investments is to know how properly to assess a company’s value. A fundamental attribute of investors is the Price to Sales (P/S) ratio which is considered a pivotal factor. In this article, we answer the questions concerning the P/S ratio’s use in investment analysis and what implications this ratio has on investment decisions.
What is price to sales ratio?
The P/S (Price to Sales) ratio is a fundamental parameter used by investors to estimate the extent to which the company can take loans and other outstanding credit compared to the revenues.
The price to sales ratio formula can be defined by dividing a company’s market capitalization by its total sales.
This ratio is quite handy for analyzing the value of a company as well as drawing a comparison of the company with peers in terms of valuation.
For instance, Firm A has a $100 million market capitalization and, in the last 12 months, has recorded annual sales of $50 million. How to calculate price to sales ratio is as follows: we can calculate it and see that Company A has a P/S ratio of 2. Such a scenario is when the investors are ready to part with $2 for every $1 in Company A’s total sales.
A sample Price to Sales Ratio Chart is as follows:
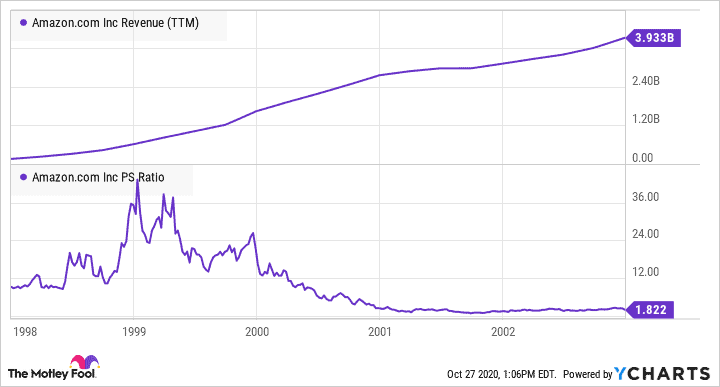
A high P/S ratio can be an indication that the stock doesn’t justify its price as an overvalued security or that the stock is undervalued than its present price.
Why does the Price to Sales ratio matter?
The Price to Sales (P/S) Ratio is a key metric that compares a company’s stock price to its revenues (sales). Unlike the Price to Earnings (P/E) ratio, which can be influenced by accounting choices and non-cash items like depreciation or taxes, the P/S ratio is based on actual sales figures. This makes it a more reliable indicator for businesses with low or negative earnings. The P/S ratio is valuable in providing insight into how efficiently a company generates revenue, regardless of whether it is currently profitable.
By comparing a company’s P/S ratio to historical data, industry standards, and competitors, investors can spot potential underpriced or overpriced stocks. A lower P/S ratio might indicate that the stock is undervalued, while a higher ratio could suggest that the stock is overpriced, though it can also be a sign of strong revenue growth potential.
Example of P/S ratio
Let us take the example of Apple Inc. (AAPL), which has a P/S of 6.79.
- Apple’s P/S ratio indicates that investors are willing to pay approximately $6.79 for every dollar of Apple’s sales.
- This suggests that Apple’s stock is moderately valued relative to its revenue, neither significantly undervalued or overvalued (good P/S ratio)
- Considering Apple’s strong brand presence, diverse product portfolio, and consistent revenue growth, the P/S ratio reflects investor confidence in the company’s future performance.
Investors should consider a combination of factors, including industry dynamics, competitive positioning, and growth prospects when interpreting P/S ratios and making investment decisions.
Benefits of Price to Sales Ratio
- Objective Measure: The P/S ratio is based on revenue, which is harder to manipulate than earnings, offering a more objective measure of a company’s valuation.
- Useful for Unprofitable Companies: For companies not yet profitable or in early growth stages, the P/S ratio is often a better gauge of value than the P/E ratio.
- Revenue Growth Insight: The ratio provides investors with insights into how well a company is generating revenue, helping to identify businesses with strong sales performance.
- Comparison Tool: It allows for easy comparison across companies in the same industry, giving investors a better understanding of a company’s standing relative to its peers.
Price to Sales Ratio: Key Limitations
While the P/S ratio is a valuable tool, it does come with some limitations:
- No Profit Consideration: The P/S ratio does not consider the profitability of a company. A company with high sales but low or negative profit margins may not necessarily be a good investment.
- Industry-Specific: Different industries have different sales models, so comparing P/S ratios across industries can be misleading. For example, a high P/S ratio in a tech company may be normal, while the same ratio in a retail company may be too high.
- Does Not Account for Debt: The ratio doesn’t factor in the company’s debt level, which could be important when assessing a company’s ability to generate sustainable profits in the future.
Conclusion
Knowing the Price to Sales (P/S) ratio is the key to the cautious investor’s success. By virtue of its straightforwardness and clarity, the ratio serves as a representation of market sentiments eventually connecting to the revenue generation potential of a company.
Unlock financial insights with StockGro! Visit us today for expert tips to navigate the markets with confidence.
FAQs
A good P/S ratio depends on the industry, but generally, a P/S ratio of 1-3 is considered healthy. A lower ratio might suggest undervaluation, while a higher ratio could indicate overvaluation or high growth potential.
To calculate the P/S ratio, divide the market capitalization (the total value of all outstanding shares) by the company’s total annual sales (or revenue).
While the P/S ratio is helpful for valuation, it is not a standalone predictor of stock prices. It should be used alongside other financial metrics, such as the P/E ratio, profit margins, and debt levels, to get a complete picture.
Not necessarily. A higher P/S ratio could be justified if the company is growing rapidly and has the potential to increase sales significantly. However, it’s important to compare the P/S ratio to industry averages and competitors.