Markets do not always roar; sometimes they whisper. There are times when the price travels far only to return to where it began, forming a small but significant candlestick known as the spinning top. This candlestick pattern hints at the hesitation and shifting momentum in the market.
In this article, we’ll explore how the spinning top candlestick pattern works and how it can be utilised in trading decisions.
What is the Spinning Top Candlestick Pattern?
The spinning top is a candlestick pattern made up of a short body compressed within two long upper and lower wicks.
The body represents the difference between the upper and lower prices, while the long wicks show that prices moved significantly higher and lower during the session but closed near where they opened.
In simple words, the market tried to move in both directions but failed to gain control.
How Does a Spinning Top Candlestick Work?
To understand how a spinning top works, let’s take a hypothetical example:
A stock opens at 9:15 am with a price of ₹500. By 12:30 p.m., buyers push it to ₹520.
Now, the sellers start to step in and drag the price down to ₹480 by 2:45 p.m. When the trading session ends at 3:30 p,m, the stock closes at ₹502.
The result is a small body composed between the long upper shadow and the lower shadow. Although the stock had swings in the trading session, in the end it closed near where it began.
Both the buyers and the sellers tried to dominate, but the closing price showed a stalemate between the two. This is where traders pay attention. The spinning top didn’t confirm the direction, but it showed that the momentum is weakening and a decision is approaching soon.
What does the Spinning Top Candlestick Pattern indicate?
The spinning top primarily indicates:
- Market indecision
- Balance between demand and supply
- Possible trend reversal or continuation
The real meaning of a spinning top depends on when it occurs and in what context it is used.
In an uptrend
If the spinning top appears during a strong rally, it means that the buyers are losing strength. The momentum is losing, and further slowdown or reversal is likely to follow.
In a downtrend
If the spinning top forms in a downtrend, it reflects the fading selling pressure. The buyers are starting to step in, and the trend will slow down or take a reversal.
In both cases, confirmation is crucial. The next candle provides direction for the market.
How the Spinning Candlestick is Formed
Let’s understand the formation of a spinning top candlestick with a real-life example. The following chart shows HDFC Bank’s price movement:
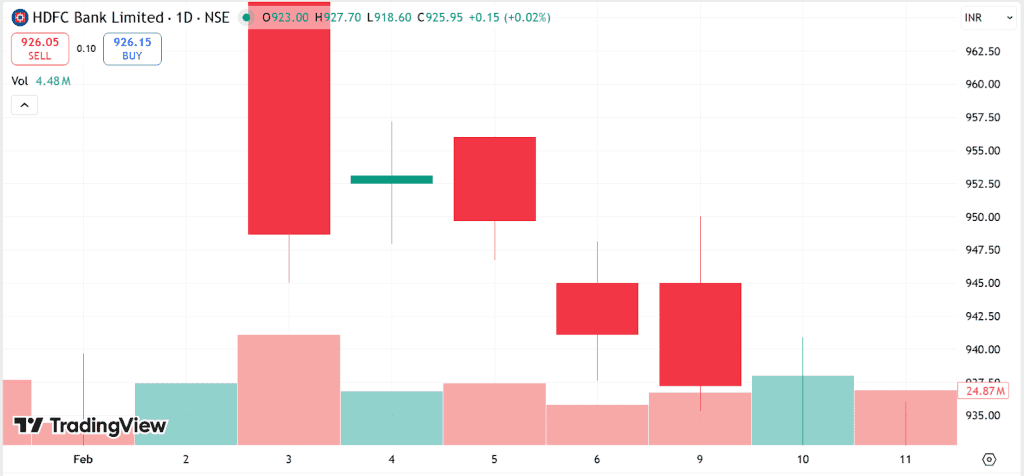
- On February 4, 2026, HDFC Bank opened at a price level of ₹952.
- During the session, buyers pushed it close to ₹958. The sellers were also building pressure on the other end, dragging the prices down to ₹948.
- When the session closed, the price settled at ₹953, slightly above the opening.
Despite moving in both directions, the price closed near the opening, creating the spinning top. It reflected almost equal forces from both the buying and selling sides.
How to Trade the Spinning Top Candlestick Pattern
You can use a methodical step-wise approach to trade with the spinning top pattern:
Step 1: Identify Trend Direction
Before you start trading, identify the broader market direction. The spinning top carries different meanings depending on where it appears during a trend, and adds more context to the market direction.
Suppose Stock ABC shows the following closing prices:
Day 1: ₹820
Day 2: ₹860
Day 3: ₹910
Day 4: ₹955
Day 5: ₹1,000
The stock is forming higher highs and higher lows, which clearly means that the market is in an uptrend.
Step 2: Spot the Spinning Top
Once the trend has been identified, look for a small candle compressed between two long wicks. Make sure the opening and closing prices are very close to each other.
On Day 6, ABC stock shows:
Opening price: ₹1,000, High: ₹1,060, Low: ₹960 and Closing price: ₹995
Body size: ₹5 difference, Upper wick: ₹60, Lower wick: ₹40
This means the candle formation is a spinning top.
Step 3: Wait for Confirmation
Don’t rush to place a trade as soon as you identify the spinning top. Currently, only the hesitation is known. Wait for the next candle as it will provide the market direction.
Spinning Top Levels:
High: ₹1,060, Low: ₹960
Next Day Candle:
| Parameter | Bearish Confirmation | Bullish Confirmation |
| Opening | ₹990 | ₹1,020 |
| Closing | ₹940 | ₹1,080 |
| Break Level | Below ₹960 | Above ₹1,060 |
Step 4: Entry and Stop-Loss
After the confirmation, you enter the trade. Managing risk becomes important at this point. Place the stop-loss just above or below the spinning top’s extreme, depending on the type of breakout.
If a bearish breakout is confirmed,
Entry: ₹950
Spinning top high: ₹1,060, Stop Loss = ₹1,065
Risk per share = ₹1,065 − ₹950 = ₹115
If targeting 1:2 risk reward: Target = ₹950 − ₹230 = ₹720
If the breakout is confirmed to be bullish,
Entry: ₹1,080
Spinning top low: ₹960, Stop Loss = ₹955
Risk per share = ₹1,080 – ₹955 = ₹125
If the target is a 1:2 risk reward target: Target = ₹1,080 + ₹250 = ₹1,330
Spinning Top Candlestick Pattern Types
The spinning top candlestick pattern is bifurcated into two types based on where the closing price lies in relation to the opening price:
Bullish Spinning Top Candlestick
When the closing price is slightly above the opening price, a bullish spinning top is formed. The body is small and green, and the long wicks show that the prices moved significantly in both directions but settled higher than the opening price.
This pattern suggests the buyers have started to lose control. Traders wait for another candle to confirm the direction before taking a long position.
Bearish Spinning Top Candlestick
A bearish spinning top appears when the price closes slightly lower than the opening price. The candle is small and red, and the long shadow signals huge price swings before settling below the opening.
The implication is that selling momentum is fading, and the prices are moving in a neutral territory. Traders confirm it with a follow-up candle to identify short-selling opportunities.
Advantages and Disadvantages of the Spinning Top Candlestick Pattern
The spinning top is a mixed bag. The merits and demerits associated with it are:
Advantages
- Early Warning: It provides an early signal that momentum is weakening and a breakout might follow soon.
- Easy Identification: The small body and long wicks are easy to spot on the charts, making it beginner-friendly.
- Versatility: The pattern works well for different timeframes as well as different trading styles.
- Provides Context: It provides context regarding the market momentum. This is useful for better timing of entry and exit positions.
Disadvantages
- Confirmation Required: The spinning top can’t be used alone. It requires confirmation from the next candle and other indicators to work effectively.
- Lack of Direction: While this pattern signals hesitation from both sides, it fails to predict where the market will move next.
- False Breakouts: The spinning top may show prices breaking out, but the prices can reverse and trap the traders.
- Frequent in Sideways Markets: The pattern appears many times when the markets are choppy or sideways. This can generate unreliable and false signals.
Conclusion
The spinning top shows a temporary hesitation in the market when both buyers and sellers are equally matched. It does not provide direction but shows the weakening momentum. When the spinning top is used with confirmation and other indicators, it can become a reliable tool for trading.
FAQs
A bullish spinning top closes slightly above its opening price, while a bearish spinning top closes slightly below. Both indicate indecision, but the closing level gives a subtle directional hint.
After a spinning top, the market either continues the existing trend or reverses direction. The next candle’s breakout above the high or below the low determines confirmation.
Start by identifying the bearish spinning top. Wait for a breakdown below the spinning top’s low. Enter short after the confirmation and place a stop loss above the top’s high.
The strategy involves identifying the trend, spotting the spinning top, waiting for breakout confirmation, entering a position, and placing a calculated stop-loss.
A spinning top works best when it appears after a strong trend and is supported by high volume, clear breakout confirmation, and proper risk management.