A stock can drop sharply in the morning, then spend the afternoon climbing in a tight, neat channel that looks like a stable recovery. The bear flag candle pattern helps explain why these small recoveries are often just pauses before another decline, with a clear drop forming the flagpole and a brief pullback forming the flag. This guide covers the rules, targets, and examples to understand the bearish flag pattern more clearly.
What is a Bear Flag Candle Pattern?
A bear flag candle pattern is a technical continuation pattern that typically appears during a strong downtrend. It signals that the prevailing negative trend is likely to resume after a brief pause. The formation resembles an inverted flag on a pole, consisting of a sharp decline (the flagpole) followed by a period of upward or sideways consolidation (the flag). Traders observe this candlestick pattern to identify potential selling opportunities as it indicates that sellers remain in control despite a temporary retracement.
How to Identify a Bear Flag Pattern?
Various visual characteristics and volume profiles distinguish this pattern on a price chart. The main components used to identify this pattern include:
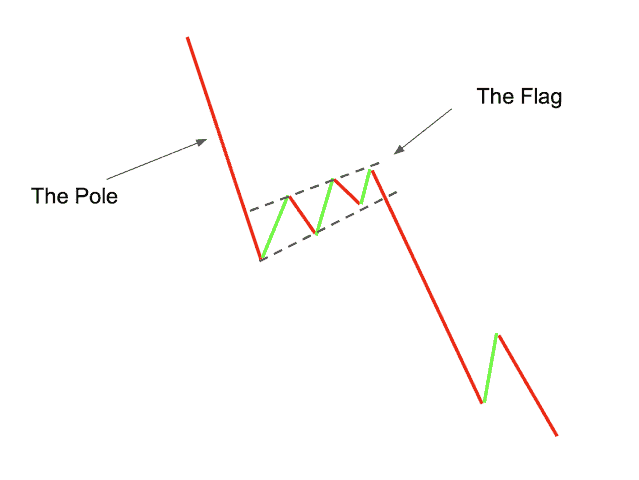
- The flagpole: This is the initial component, characterised by a steep, sharp decline in price with high volume. The move is often nearly vertical and indicates strong selling pressure or a panic drop.
- The flag (consolidation): Following the sharp drop, price action enters a consolidation phase. This “flag” typically creates a channel formed by two parallel trendlines that slope slightly upward against the prevailing downtrend. It represents a pause where buyers attempt a weak recovery.
- Volume profile: Volume plays a critical role in identification. Trading volume is usually high during the formation of the flagpole, decreases or “dries up” during the consolidation (flag) phase, and spikes again upon the breakdown.
- The breakdown: The pattern is confirmed when the price breaks below the lower support trendline of the flag. This breakout signals the end of the consolidation and the resumption of the bearish trend.
- Duration: The consolidation phase is generally short-term. If the “flag” extends for too long (e.g., several weeks or months), it may morph into a different pattern or lose its predictive power as a continuation signal.
How does a Bearish Flag Chart Pattern Look Like?
Visually, this pattern appears on a chart as a distinct “stair-step” downward formation that interrupts a steep drop with a brief upward pause. The specific features that define its look include:
- It resembles a vertical line dropping straight down, followed immediately by a compact, tilted rectangle that drifts slightly upward.
- The entire shape often looks like an inverted flag attached to a pole or the lowercase letter “h” written on the chart.
- The price movement within the pause creates a neat channel where the highs and lows form two parallel lines, rather than a triangle or a messy cluster.
- The upward slope of the “flag” portion is usually gentle and narrow compared to the sharp, aggressive vertical drop that precedes it.
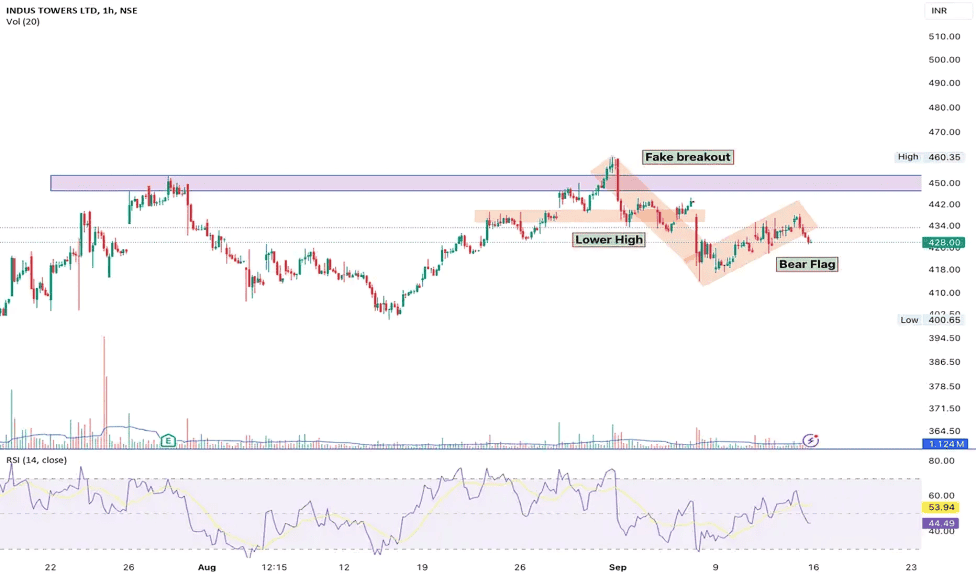
For example, the Indus Towers Ltd chart from September 2024 clearly shows this pattern. After a sharp price drop around September 6–9 (the flagpole), the stock paused and drifted slightly upward in a narrow channel from September 9 to September 13 (the flag), before signaling a possible continuation of the decline.
When Does a Bearish Flag Chart Pattern Form?
The bear flag candle pattern does not occur in isolation but rather as a specific sequence within broader market movements. The conditions under which this pattern typically forms are:
- During strong downtrends: The pattern forms exclusively within an existing bearish trend. It is not a reversal pattern but a continuation signal, meaning the market must already be in a decline before the flag appears.
- After aggressive selling: It typically manifests immediately after a rapid, impulsive sell-off. This sharp move (flagpole) creates an “oversold” condition where the market needs to stabilise before moving lower.
- During profit taking: The “flag” or consolidation phase often forms when short sellers begin taking profits from the initial drop. This buying pressure, combined with minor bargain hunting, causes the slight upward drift in price.
- In the middle of market pauses: It forms when the market is “catching its breath.” The selling momentum pauses temporarily, but new heavy buying interest fails to materialise, resulting in a weak, corrective price channel.
- Before news events: Occasionally, these consolidations occur as the market waits for a catalyst or news confirmation to push prices to new lows, keeping volatility lower within the flag until the news triggers the breakdown.
What Does a Bearish Flag Chart Pattern Indicate?
The formation provides specific insights into market psychology and the balance of power between buyers and sellers. Implications of this chart formation include:
- Uprising of sellers: The pattern indicates that despite the pause in downward movement, sellers remain firmly in control. The upward retracement (flag) is weak and lacks the conviction to reverse the trend.
- Temporary respite: It suggests that the current price stability is merely a temporary respite or “breather” for the market, rather than a bottoming process. The market is consolidating energy for the next leg down.
- Likely trend continuation: The primary indication is that the prior downtrend is highly probable to continue. The breakdown serves as technical confirmation that the bears have overwhelmed the temporary buying pressure.
- Target projection: It offers a measurable target for the subsequent price move. The implied movement after the breakout is often expected to mirror the magnitude of the initial drop (flagpole).
- Market behaviour: A bear flag reflects negative market sentiment where rallies are viewed as selling opportunities rather than buying opportunities. It shows that investors are eager to exit positions on any slight bounce.
How to Trade the Bearish Flag Pattern?
Trading this pattern involves precise rules for entry, risk management, and profit-taking based on technical levels. Strategies associated with this pattern involve steps such as:
- Entry on breakout: Traders typically look for a short entry when the price closes decisively below the lower trendline of the flag. Some strategies involve entering on the initial breakdown candle, while others wait for a “retest” where the price returns to the broken support line (now resistance) before dropping.
- Volume confirmation: A valid entry is often supported by a surge in volume at the moment of the breakout. If the price breaks down on low volume, it is viewed with caution as it may result in a “false breakout” or bear trap.
- Stop-loss placement: Risk management is standardly handled by placing a stop-loss order just above the upper trendline of the flag structure. Alternatively, for a tighter stop, it may be placed above the most recent swing high within the consolidation. This invalidates the trade if the price reverses back into the flag.
- Profit target calculation: The standard method for determining the profit target is the “measured move.” Traders measure the height of the flagpole (the distance of the initial drop) and project that same distance downward from the point of the breakout.
- Trailing stops: As the price moves in the favorable direction, traders often use trailing stops (moving the stop-loss down) to lock in profits, particularly if the trend is strong and exceeds the initial measured target.
Advantages and Disadvantages of Bear Flag Pattern
Like all technical indicators, the bear flag candle pattern has distinct strengths and weaknesses that impact its reliability. The pros and cons of this pattern are as follows:
Advantages
- Favorable risk-to-reward ratio: The pattern offers clear parameters for risk management. Because the stop-loss is placed just above the narrow consolidation flag, the potential profit (based on the large flagpole) is usually significantly larger than the risk, offering attractive R:R ratios.
- Clear identification: The visual structure of a steep drop followed by a parallel channel is relatively easy to identify on charts compared to more complex patterns.
- Defined targets: The “measured move” concept provides an objective, mathematical way to set profit targets, reducing the need for guesswork regarding where to exit the trade.
- High frequency: It is a common pattern that appears across various timeframes (intraday to weekly) and asset classes, providing frequent trading opportunities in trending markets.
Disadvantages
- False breakouts: A primary risk is the false breakdown, where the price pierces the lower trendline to trigger entries but then sharply reverses upward. This can trap short sellers.
- Subjectivity in drawing: Identifying the exact trendlines of the flag can sometimes be subjective. Different traders might draw the channel slightly differently, affecting entry and stop-loss levels.
- Context dependency: The bear flag pattern is less reliable if it forms near major support levels or if the overall market trend is losing momentum. Trading it in a choppy or range-bound market often leads to failure.
- Whipsaws: During the consolidation phase, price action can be volatile, potentially triggering tight stop-losses before the actual move occurs.
Bearish Flag vs Bearish Pennant
The main differences distinguishing the bearish flag from the bearish pennant consist of:
| Feature | Bearish flag | Bearish pennant |
| Chart shape | Resembles a tilted rectangle or parallel channel. | Resembles a small symmetrical triangle or tapering wedge. |
| Trendlines | Formed by two parallel trendlines sloping upward. | Formed by two converging trendlines meeting at an apex. |
| Consolidation | Price drifts upward evenly within a fixed width channel. | Price coils tightly with lower highs and higher lows. |
| Duration | Typically lasts 1 to 4 weeks (short-term). | Typically lasts 1 to 3 weeks (very short-term). |
| Breakout point | Occurs when price crosses the lower parallel support line. | Occurs when price crosses the lower ascending trendline. |
| Preceding move | Requires a steep, almost vertical drop (Flagpole). | Requires a steep, almost vertical drop (Flagpole). |
Conclusion
Locating market pauses is just as important as locating the trend itself. The bear flag candle pattern helps make sense of the choppy movement that happens in the middle of a drop. By waiting for this clear shape to form, you can see that the downward trend is likely just pausing. It turns confusing price action into a readable signal.
FAQs
The bear flag pattern shows 65–70% reliability for trend continuation in backtests, particularly when confirmed by volume spikes on breakdown and formation in strong downtrends. However, false breakouts occur near support levels or in choppy markets, reducing effectiveness without proper context.
Confirmation occurs when price closes decisively below the flag’s lower support trendline, accompanied by a volume surge indicating renewed selling pressure. This breakdown after the flagpole drop and consolidation validates resumption of the downtrend, distinguishing it from failed setups.
No, a bear flag is inherently bearish as a continuation pattern in downtrends, signaling sellers remain in control after brief consolidation. A bullish version would be a Bull Flag in uptrends; mistaking direction leads to poor trades.
A bearish flag is a continuation pattern in downtrends featuring a sharp vertical drop (flagpole) on high volume, followed by brief upward-sloping consolidation (flag) on declining volume, then breakdown below support to resume lower prices.
Bearish flags work well intraday on short-term charts during strong downtrends but face higher false breakout risks from noise. Reliability improves with volume confirmation and tight channels; use of 15-min/1-hour timeframes with strict stops for best results.