
Spotting a market reversal before it happens is one of the toughest parts of trading. Many traders enter too late or get stuck when the trend flips. The bearish abandoned baby pattern can be useful here, it’s an uncommon candlestick formation that may indicate a transition from an uptrend to a downtrend. This article will cover the definition of this pattern, methods for spotting it, and other important details.
What is the Bearish Abandoned Baby Candlestick Pattern?
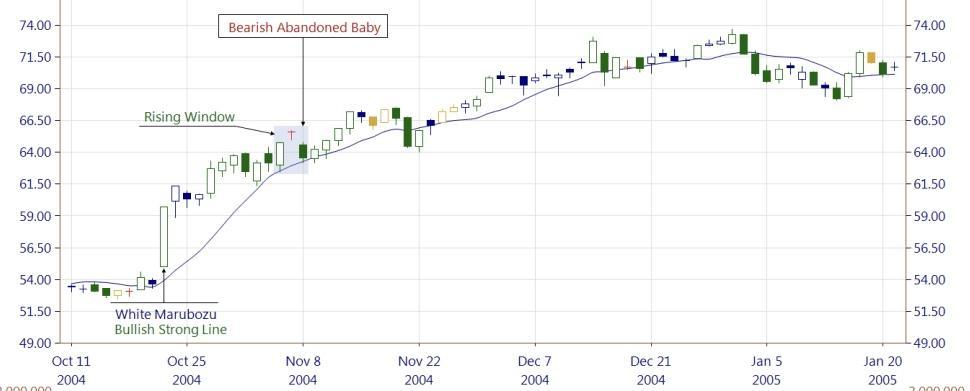
The bearish abandoned baby is a candle stick pattern in financial charts that consists of three candles and suggests a potential, at least temporary, reversal of an upward price trend. Its rarity is notable, but it is considered a significant indicator for forecasting a potential shift from a bullish to a bearish market.
How is Bearish Abandoned Baby Candlestick Formed?
This pattern is formed by a specific sequence of three candles at the peak of an uptrend, signaling a transition from buying to sudden selling.
- First Candle: A large, green (or white) candle appears in the direction of the prevailing uptrend.
- Second Candle: A Doji candle (where open and close prices are nearly identical) forms, with its entire range (including its high and low) gapping above the high of the first candle.
- Third Candle: A large, red (or black) candle forms, opening below the Doji. The complete gap around the Doji is what makes this formation unique and reliable.
What does Bearish Abandoned Baby Candlestick tell?
The bearish abandoned baby candlestick suggests a possible reversal of an ongoing uptrend. It often signals a loss of buying strength and a shift toward selling pressure. For the pattern to be considered valid, the first and third candles must be clearly strong, and the final candle should push prices lower than at least half the first candle’s body. While considered reliable, this pattern is rare and best viewed alongside other analysis tools.
Example of Bearish Abandoned Baby candlestick pattern
To grasp the bearish abandoned baby pattern more clearly, let’s walk through an example that illustrates how it appears on a chart.
Let’s say a stock named XYZ Ltd has been on a strong uptrend and is currently trading around ₹580. One trading day, it forms a large bullish candle, closing at ₹580. The next day, the price gaps up and forms a Doji at ₹590, indicating hesitation among buyers. On the third day, the price opens lower at ₹575 and closes even lower at ₹560, leaving a clear gap on both sides of the Doji. This three-day sequence forms the bearish abandoned baby pattern, hinting at a potential reversal as selling pressure begins to dominate.
When does Bearish Abandoned Baby Candlestick happen?
There are various factors that can cause this pattern to form, namely:
- Profit-taking: Traders may start selling after a strong uptrend, leading to a gap down as gains are booked.
- Bearish news or events: A shift in market mood can be triggered by unfavorable news reports or corporate earnings that fail to meet expectations.
- Technical triggers: Overbought conditions or resistance levels may signal selling opportunities.
- Lack of buying support: If buyers pull back, the absence of demand can cause prices to drop sharply, completing the pattern.
How to read Bearish Abandoned Baby Candlestick in Technical Analysis?
This pattern captures a major shift in price direction and market emotion:
- The first candle confirms strong bullish activity.
- The Doji candle reflects uncertainty buyers start to hesitate.
- The third candle shows sellers stepping in, pushing the price down.
The complete structure suggests the uptrend might be reversing, and the market may enter a bearish phase. It’s a price action snapshot of a potential trend reversal.
How accurate are the Bearish Abandoned Baby Candlestick in Technical Analysis?
The pattern is considered a highly reliable but very rare candlestick pattern in technical analysis. Its accuracy is increased because the strict criteria for its formation, particularly the complete gap surrounding the Doji, do not occur frequently. While no pattern is 100% accurate, its rarity means that when it does appear correctly, it is seen as a more significant signal for a potential trend reversal than more common patterns.
When is the best time to Trade using Bearish Abandoned Baby Candlestick?
The best time to act on a bearish abandoned baby pattern is after it fully forms, when the third candle closes and confirms the shift in sentiment. At this stage, price action has already signaled a possible reversal. While the pattern itself suggests weakening bullish momentum, traders often wait for additional signs like a break below recent support or rising volume, to build confidence. The reliability of this pattern improves when it is confirmed by other technical indicators or the general market trend.
How to Trade with Bearish Abandoned Baby Candlestick in Stock Market?
Follow these steps to trade the bearish abandoned baby in stock market:
- Spot the pattern: Look for the three-candle structure on a daily or weekly chart, bullish candle, gapped doji, and bearish candle.
- Confirm formation: Ensure the doji has no overlap with the candles on either side, and the third candle closes lower.
- Enter the trade: Short the stock after the third candle closes below the previous day’s low.
- Set a stop loss: For risk management, place it slightly above the peak of the pattern’s final candle.
- Define your target: Set a profit level near a support zone that fits your risk-reward plan.
- Track price movement: Watch the trade and adjust only if the price action changes significantly.
Where is the Bearish Abandoned Baby commonly used?
The bearish abandoned baby pattern is widely used in technical analysis across markets like equities, commodities, indices, and currencies. It helps spot potential reversals at the top of an uptrend, giving traders an early signal that momentum may shift. While the pattern itself suggests a possible downturn, it is usually combined with other tools such as support/resistance levels or trendlines to confirm the signal and refine trade decisions. Its application is mostly seen in short to medium-term strategies where timing a trend change is essential.
Is the Bearish Abandoned Baby in an Uptrend a Sell Signal?
Yes, when this pattern forms during an uptrend, it’s generally seen as a potential sell signal. The sudden shift from buying strength to selling pressure suggests the trend may be weakening. For this reason, traders may use it to exit long positions or consider short opportunities, especially if supported by further confirmation like a break below a key support level or increased volume on the bearish candle.
What are the advantages of Bearish Abandoned Baby Candlestick Pattern?
The pattern offers several notable advantages such as:
- Acts as an early warning sign of a bullish trend reversal.
- Reliable across both short-term and long-term timeframes.
- Easy to spot due to its unique three-candle structure
- Can help traders exit long positions before sharp declines.
- It offers a distinct signal that investor attitudes are changing.
- Can be applied effectively across diverse market segments, including equities, commodities, etc.
- Reliability improves when paired with other technical tools or indicators.
What are the disadvantages of Bearish Abandoned Baby Candlestick?
Despite its strength, this pattern has limitations:
- Appears very rarely on charts, limiting trading opportunities.
- May generate false signals without proper confirmation.
- Effectiveness decreases in sideways or low-volume markets.
- Requires use of other tools for accurate interpretation.
- Market news or events can quickly invalidate the pattern.
- Doesn’t predict the exact timing or depth of a reversal.
- Overreliance may lead to poor trades if used alone.
- Beginners may misinterpret similar-looking formations.
What is the difference between a Bearish Abandoned Baby and a Bullish Abandoned baby?
Though similar in appearance, these two candlestick patterns point in opposite directions. Their meaning depends entirely on where they appear in a trend. The table below highlights how they differ in setup and market implication:
| Feature | Bearish abandoned baby | Bullish abandoned baby |
| Appears after | Uptrend | Downtrend |
| Direction of reversal | Bullish to bearish | Bearish to bullish |
| Trader sentiment shift | Buyers losing momentum | Sellers losing momentum |
| Market implication | Possible sell signal | Possible buy signal |
What Candlestick Pattern is Similar to Bearish Abandoned Baby Candlestick?
The evening star is often seen as a close counterpart to the bearish abandoned baby. Though their formations vary a bit, both patterns suggest the ongoing uptrend could be losing strength. Minor design differences aside, to capture early signs of weakening bullish momentum. Traders often study them together to understand different reversal setups, especially in volatile markets.
Difference between Bearish Abandoned Baby and Evening Doji Star Candlestick Pattern
Although these two formations both suggest a potential downturn, their primary distinctions are found in their visual structure and predictive consistency. Here’s how they differ:
| Feature | Bearish Abandoned Baby | Evening Doji Star |
| Number of Candles | Three | Three |
| Second Candle | Always a Doji | Always a Doji |
| Gap Around Doji | Complete gap on both sides | No complete gap; Doji within prior range |
| Position of Doji | Doji is isolated from both candles | Doji is within the range of first and third candle |
| Trend Direction | Forms after an uptrend | Forms after an uptrend |
| Signal Strength | Considered more reliable | Reliable but slightly weaker |
| Rarity | Rare | Less rare |
Conclusion
When markets speak, patterns like the bearish abandoned baby help decode the message. Its rare appearance and distinct structure often reflects weakening buyer interest and growing selling pressure. When paired with other technical tools, it’s a signal worth noticing, especially when timing and sentiment matter. Always pair it with context, not just instinct.
FAQ
The bearish abandoned baby pattern is recognised by many technical analysts as a signal that may indicate a potential reversal from an uptrend to a downtrend. Traders often interpret this pattern as a bearish indicator and may use it as a basis for short trades or to exit long positions. However, the occurrence of this pattern is rare and some prefer further confirmation from additional technical indicators before making trading decisions.
There are two main types of abandoned baby candlestick patterns, the bearish abandoned baby and the bullish abandoned baby. The bearish pattern typically emerges at the top of an uptrend, suggesting a possible reversal to a downward trend, while the bullish abandoned baby forms at the end of a downtrend, signaling potential upward movement. Both patterns are viewed as reversal signals, though their appearance in market charts is considered quite rare.
The bearish abandoned baby candlestick pattern is often perceived as most meaningful and effective when it appears on daily or higher timeframes, such as weekly charts. Many technical analysts believe that this pattern, when found after a significant upward trend on these lengthier intervals, provides a stronger potential reversal signal due to increased market participation and reduced market noise, as shorter timeframes may generate more false or less reliable indications.