One of the biggest challenges in trading is spotting the start of a big move before it gets momentum. Often these moves are marked by a sudden price gap that leaves you no time to react. A breakaway gap helps with this by being an early signal when price exits a consolidation zone. It’s not just any gap, it’s generally at the start of a big price phase. In this blog we’ll cover what a breakaway gap is, the types of breakaway gaps and how it’s used in trading.
What is a Breakaway Gap?
A breakaway gap is a visible price gap pattern on a chart where no trading occurs between the previous close and the new session open. It often occurs near major support or resistance levels and means price is moving away from previous ranges. These gaps are usually caused by news or market activity.
How Does a Breakaway Gap Form?
A breakaway gap forms when price activity breaks away from previous levels due to sudden changes in sentiment. The candlestick pattern formation steps include:
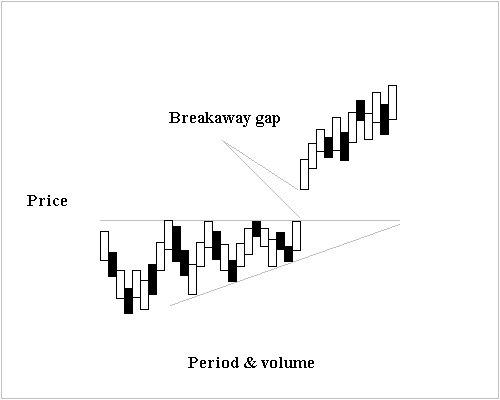
- Price consolidates near a key level: Before the gap, the price typically moves in a tight range near support or resistance, indicating balance between buyers and sellers.
- Trigger events cause a sharp reaction: News, earnings, or economic data disrupts the balance, prompting strong buying or selling interest.
- Gap appears on the chart: The next session opens far from the previous close, leaving an untraded area or “gap” on the chart.
- High volume confirms the move: The price gap is supported by a noticeable increase in volume, showing wide participation behind the move.
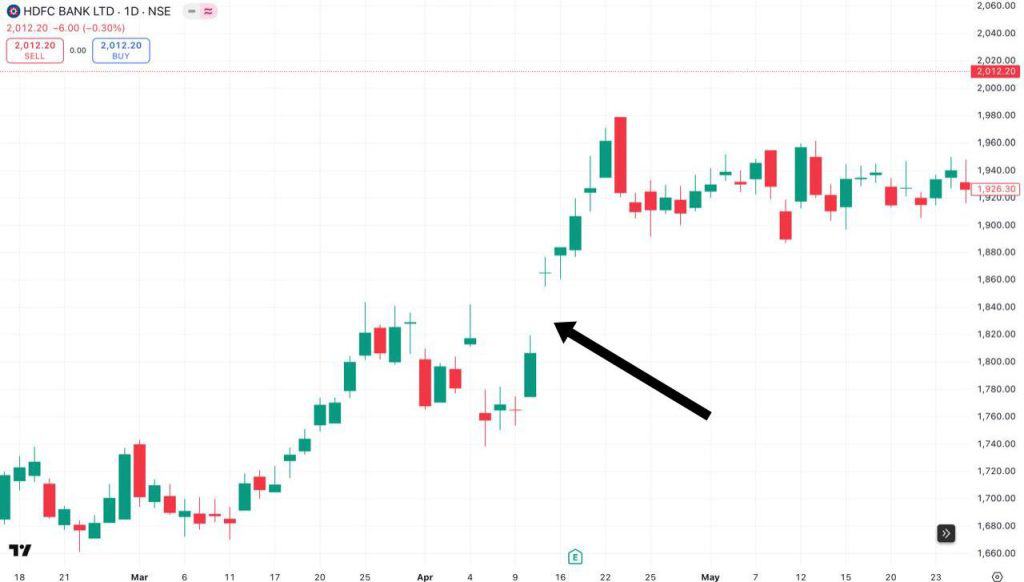
Let’s look at an example, in the chart below of HDFC Bank Ltd. a breakaway gap appeared between 12th and 15th April 2025. The price jumped sharply after a consolidation phase, signaling a strong shift in market sentiment.
How is the Breakaway Gap used in Technical Analysis?
Breakaway gaps are studied to understand strong changes in price direction. These gaps may appear near the start of a new price pattern and are used to assess possible entry or exit points. If the gap moves with the existing price direction, it may reinforce the strength of that move. Traders often look for added signals like increased volume to confirm the gap’s relevance. Stop-loss levels may be placed below or above the gap to manage risks. These gaps are often reviewed along with other tools, helping technical analysts understand whether the price action is gaining strength or slowing down.
Types of Breakaway Gaps
Breakaway gaps are broadly classified into two types:
- Bullish Breakaway Gap
This type appears after a downtrend or a sideways phase. The price opens above a known resistance level with a strong rise in volume, indicating aggressive buying interest. It often forms alongside reversal patterns like a cup and handle, confirming a shift in control.
- Bearish Breakaway Gap
This gap occurs after an uptrend or price consolidation. The price opens below support with a surge in selling volume, showing strong pressure from sellers. It can signal the start of a downward phase, especially when paired with topping patterns.
Breakaway Gap vs Continuation Gap vs Exhaustion Gap
A brakeway gap differs from other types such as continuation gap and exhaustion gap by forming early in a major price move, while others occur mid-move or near the end. Here’s how they differ:
| Gap Type | Description | Volume | Implication |
| Breakaway | Forms after consolidation and signals a new direction | High | New price direction |
| Exhaustion | Happens near the end of strong movement | High | Possible price reversal |
| Continuation | Occurs mid-way during sustained movement | Low to moderate | Extension of movement |
Psychology Behind the Breakaway Gap
Breakaway gaps happen when traders react strongly, often after unexpected news, pushing prices far from previous levels. These sudden movements leave a clear gap on the chart. Traders who missed the first move may later jump in, adding further strength. This behavior often reflects high confidence, especially when prices move past known resistance or support. The eagerness to participate, even at higher or lower prices, shows that participants believe the price move has strong backing from broader market forces.
How to Identify Breakaway Gaps on Charts
Breakaway gaps can be identified by looking at its core indicators:
- A big increase in trading volume often accompanies the gap, meaning wide participation in the move.
- Price moves abruptly beyond key levels instead of gradually through them during regular trading.
- Gap appears with well known patterns like head and shoulders, cup and handle or double tops and bottoms.
- Breakaway gaps have four elements: they occur at the beginning of a new phase, have high volume, create a clean gap and break through previous price zones.
How to Trade the Breakaway Gap Pattern
To use breakaway gaps in trading, simply follow these steps:
- Check the gap: Is it big, has high volume and support from chart patterns.
- Look at previous direction: If the gap goes in the same direction as previous price move, it may be a confirmation. If it goes the other way, it may be a change.
- Plan entry: Do you follow the gap or wait for a pullback. You can enter immediately or after a slight price retrace.
- Manage risk: Set stop loss below the low (for up gaps) or above the high (for down gaps).
- Monitor: Keep an eye on price action post gap. Adjust your approach based on new chart signals.
- Use different timeframes: Adapt the strategy to daily, hourly or intraday charts depending on your trading style.
Best Indicators to Confirm a Breakaway Gap
These technical indicators help verify whether a breakaway gap is backed by strong market activity:
- Volume
Volume analysis tracks how many units of a stock or asset are bought and sold within a given time.A large spike in volume during a breakaway gap suggests strong buying or selling interest, adding strength to the gap’s reliability.
- RSI (Relative Strength Index)
RSI is a number that shows how fast and how much the price has recently moved up or down. When a breakaway gap forms near the extreme ends of the RSI scale, it may signal that the price is breaking out from an overheated or oversold zone.
- EMA (Exponential Moving Average)
EMA is a line on the chart that gives more weight to recent price changes to reflect short-term price behavior. A breakaway gap that appears above or below an EMA line and holds above or below it can support the idea that the price has moved into a new phase.
Breakaway Gap Trading Strategies
Some of the most effective strategies to trade brakeway gap are:
- Wait for the gap to form with high volume and a clear break above resistance or below support before you trade.
- If the gap is upward, look for a pullback to the gap area as an entry instead of entering immediately.
- In a down breakaway, wait for a small bounce back to the gap zone to short sell, so you don’t enter at the low.
- Use candlestick patterns or RSI and MACD to confirm before you place the order.
- Set stop loss below the gap for a long trade or above it for a short trade to limit your loss if price reverses.
- For targets, measure the previous price range before the gap and project it forward in the direction of the move.
- Don’t chase the price after a big gap unless it’s supported by strong volume and price
Entry and Exit Rules for Breakaway Gaps
Entry and exit decisions depend on how the breakaway gap behaves after it forms. The entry and exit rules for it are as follows:
- Entry after confirmation: Enter once price confirms the gap by going in the same direction during early trading hours or next session, with high volume support.
- Pullback entry: If price retracts to the gap zone without filling it, enter near this level with support or resistance confirmation.
- Avoid early entry: Don’t enter just because of the gap, wait for supporting signs like volume spikes or strong candles in the gap direction.
- Set stop-loss: For bullish gaps, set stop-loss below the gap low; for bearish, above the gap high.
- Exit strategy: Exit partial at predetermined price targets or technical levels; use trailing stops to protect profits as price moves further.
- Exit on failure: If price fails to hold above/below the gap and enters the gap, close the position to avoid deeper reversals.
Limitations & False Signals of Breakaway Gaps
Breakaway gaps can be useful but also have limitations:
- Breakaway gaps can lead to temporary price spikes that reverse quickly, so they are not reliable without other confirmation.
- Entering or exiting based on gaps can be tricky due to fast price moves and prices may retrace before continuing.
- Traders may chase the price after a gap and buy at highs or sell at lows especially when short term levels get stretched.
- Gaps don’t happen often so opportunities are limited especially in stable or low volatility markets.
- Sometimes price breaks out with a gap but fails to sustain and reverses back into the previous range and traps those who acted on the initial breakout.
Conclusion
A breakaway gap often signals a decisive move away from past price levels, making it a useful reference point for technical analysis. It forms with strong volume and stands out on the chart. While not always reliable alone, combining it with indicators helps improve accuracy. Understanding how to spot and respond to these gaps adds clarity to market behavior.
FAQs
Breakaway gaps are considered moderately reliable, especially when confirmed by high volume and trend strength, but backtesting shows their standalone success rate is often low due to many false signals. Pairing it with other indicators improves reliability.
Breakaway gaps are less reliable on intraday charts as gaps on shorter timeframes are more likely to be filled or give false signals due to market noise. They are more dependable on daily or longer charts with high volume.
Yes, breakaway gaps can form in both forex and crypto. In forex, they often happen at weekly openings or during major news. In crypto, gaps are rare due to continuous trading but can appear after high-impact announcements or price shocks.