A stock stays in the same range for hours. Right after the trade is closed, the price suddenly shoots up. This kind of move often feels frustrating, but it’s not just bad luck, it could be a missed breakout. Many intraday traders face this when they avoid breakouts, unsure if the move is real. Knowing how to spot breakout and breakdown patterns can help avoid these situations. In this blog, we discuss how these patterns work, how to identify them so you don’t exit five minutes too early or enter five seconds too late.
What is a Breakout in Trading?
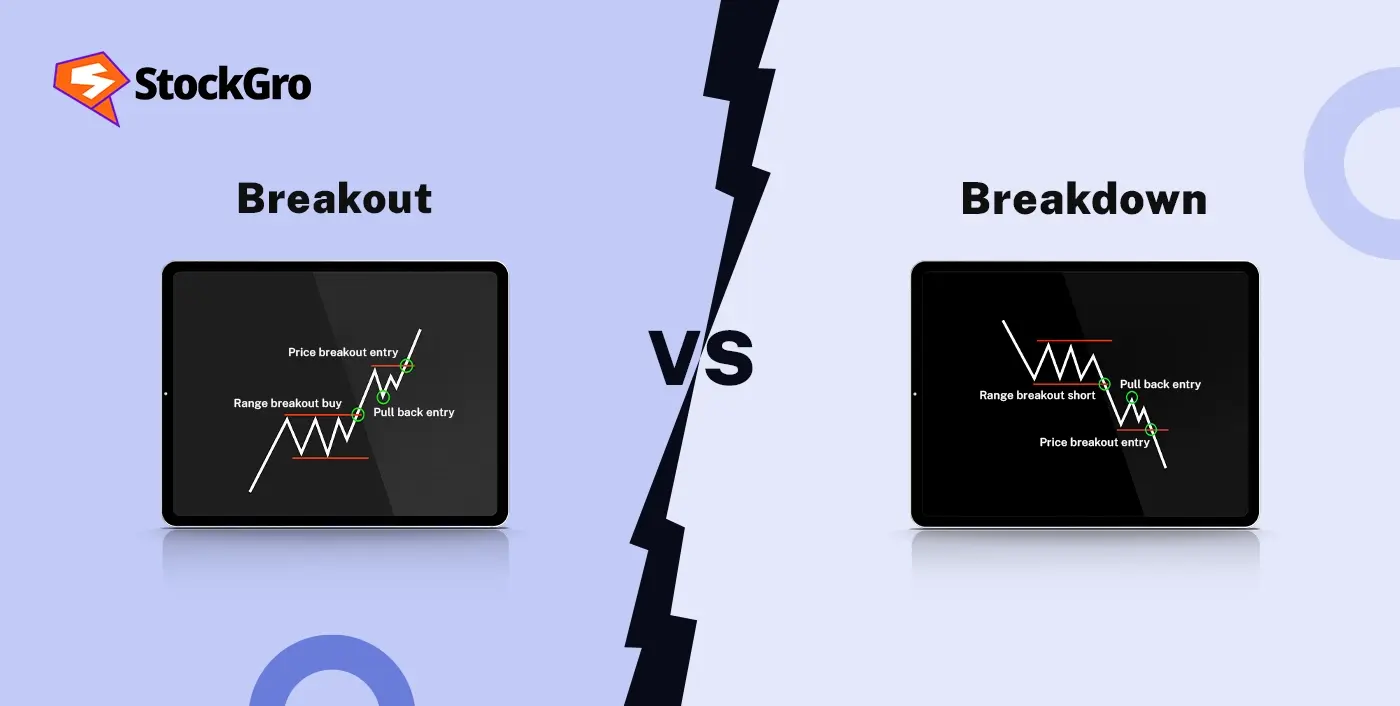
A breakout occurs when price moves above a key resistance level with strong volume, signaling bullish momentum and potential start of an uptrend. This resistance acts like a ceiling where sellers were active before. When the price crosses it with strength, it signals that buyers are now in control. Breakout trading focuses on capturing this price movement as the asset enters a new higher range.
What is a Breakdown in Trading?
A breakdown occurs when price falls below a key support level, signaling bearish momentum and potential start of a downtrend. A breakdown takes place when this support usually a price floor that held up in the past no longer holds. Sellers dominate, and the price enters a new lower range. In breakdown trading, this fall is important because it shows the market has moved below a level where buyers once stepped in.
Key Differences Between Breakout and Breakdown
Both breakout and breakdown involve a price moving beyond core levels, but in opposite directions. Here’s how they differ:
| Feature | Breakout | Breakdown |
| Definition | The price moves clearly above a vital resistance level. | The price drops clearly below a vital support level. |
| Market signal | Seen as a bullish move that may continue upward. | Seen as a bearish move that may continue downward. |
| Underlying force | Buying strength overcomes earlier selling. | Selling strength overcomes earlier buying. |
| Psychology | Reflects rising confidence among buyers. | Reflects growing control by sellers. |
| Typical follow action | Traders may look for buying opportunities. | Traders may look for selling or exit points. |
Indicators Used for Breakout and Breakdown Confirmation
To separate genuine price movement from a false signal, traders often turn to technical indicators. Using more than one indicator together can give a clearer view. Here’s a closer look at three common tools and how they confirm breakout and breakdown:
- Moving Averages
A moving average evens out price movements to show the general direction. When price is clearly above a major moving average like the 50 or 200, it can confirm a breakout if the average had been resistance in the past. If price is below a major moving average that has been supported, it can support a breakdown. Crossovers between a short term average (like the 20) and a long term average (like the 50) are also watched. A crossover from below is considered confirmation of a breakout, a crossover above is considered confirmation of a breakdown.
- Volume Analysis
Volume shows how many shares or contracts are being traded, the strength behind a price move. A real breakout is often backed by a big increase in volume, showing strong buying interest and broader participation. A breakdown becomes more reliable when it’s accompanied by a clear volume spike, showing increased selling activity. For example, when Nifty traded above 25,000 in June, many stocks showed big volume spikes along with price breakouts, confirming strong buying interest and helping the index to stay in the higher range for some time. When a move happens without any change in volume, it may suggest lack of commitment from market participants and the price may come back to its earlier range.
- Trendlines and Patterns
Trendlines are straight lines drawn on charts to connect price highs or lows, showing areas where price had reacted in the past. When price moves above a descending trendline, it supports the idea of a breakout. If price falls below an ascending trendline, it can support a breakdown. These lines often form part of patterns like triangles, flags or channels. A move beyond the pattern boundary can confirm that the price has broken out of a pause or buildup.
Examples of Breakout and Breakdown Patterns
Now let’s take examples of two common patterns using charts from 7th August 2025, one showing a breakout and the other a breakdown.
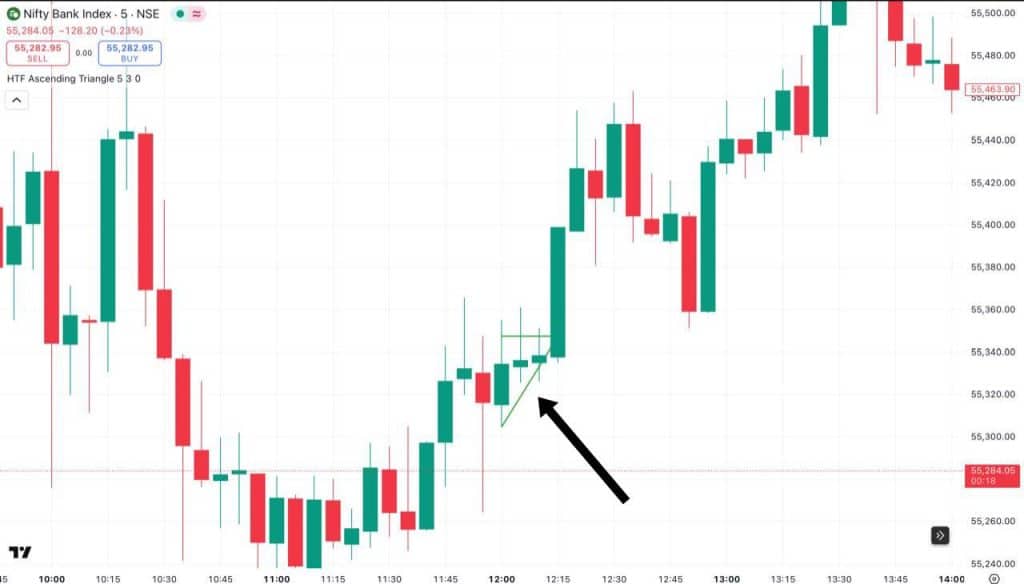
- Ascending Triangle Breakout
Around 12:15 PM on the 5-minute chart of Nifty Bank Index, an ascending triangle formed with higher lows and flat resistance. Price broke above the resistance level with a strong green candle, confirming the breakout.
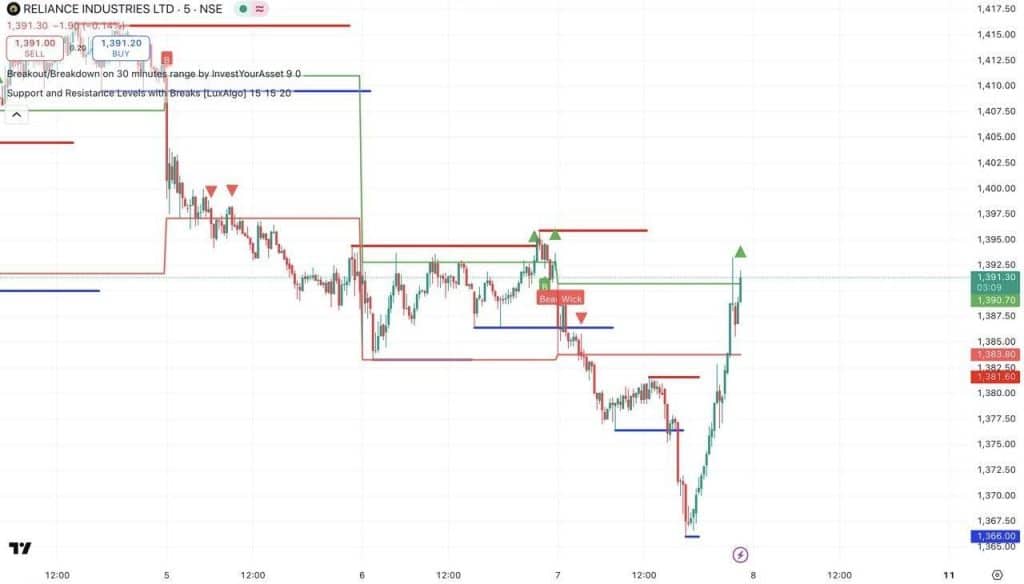
- Support Breakdown
On the 5-minute chart of Reliance Industries Ltd. below, support near ₹1,382.50 was tested multiple times. Around 11:30 AM, the price broke below this level and continued falling, showing a strong breakdown through a previously held support.
Common Mistakes When Trading Breakouts and Breakdowns
The most frequent errors made during such trades include:
- Entering a trade before the price candle fully closes beyond the support or resistance, which can result in reacting too soon to a false move.
- Jumping into a trade late due to fear of missing out, often after the biggest move has already happened, which limits reward and increases risk.
- Overlooking volume as a deciding factor, as moves on weak volume don’t show strong participation and may not hold.
- Not checking the bigger market condition, which can impact whether the breakout or breakdown has enough support to sustain.
- Trading without a structured plan, like no entry points, exit goals or stop-loss rules, which increases emotional decision making.
- Confusing a short lived price spike with a proper breakout, leading to trades that turn against the trader when price comes back.
Tips for Successful Breakout and Breakdown Trading
A few careful tips can help successfully deal with breakout and breakdown trading:
- Wait for a full candle close beyond the key level helps confirm the move more clearly than reacting mid-session.
- Use multiple checks like volume increase, moving average support and pattern break together can make the signal more reliable.
- Look out for a reset of the broken level where the price comes back and holds the line before moving in the same direction can act as added confirmation.
- Watch for a retest of the broken level, where the price returns and holds the line before continuing in the same direction, which can act as added confirmation.
- Always use a stop loss allows you to control your risk if it doesn’t work.
- Set a clear profit or exit target in advance ensures decisions are based on logic, not emotion.
- Note how long the price had stayed in the earlier range helps, as breakouts from long periods of tight movement can lead to larger moves.
Conclusion
A breakout and breakdown don’t just happen, they build up over time. What happens around these levels can say a lot about who’s in control: buyers or sellers. Learning to read this behavior clearly, with the help of handy indicators, can make these moves feel less sudden and more structured.
FAQs
A breakout is when the price goes above a level it couldn’t pass earlier, showing possible upward movement. A breakdown is when the price falls below a support level, showing signs of a downward move. Both often signal a new trend.
To confirm a breakout or breakdown, traders look for a strong price move beyond a key level, along with high trading volume. Additional tools like indicators can help make sure the move is real, not just a quick spike.
Some of the most helpful indicators include volume bars, volume weighted average price, OBV (On-Balance Volume), moving averages, RSI, and MACD. These tools help traders understand whether a price move is strong enough to continue or likely to reverse.
A false breakout happens when price briefly moves beyond an important level but quickly returns back. This can trick traders into entering a trade too soon and often happens when there isn’t strong volume.
Traders try to enter trades just as the price breaks through support or resistance. If the move continues, they may ride the trend for a profit. Confirmation and risk control help avoid losses if the move turns out to be false.