Markets don’t just move – they test, trap, and tempt traders at every key level. One price swing can spark excitement, while another can wipe out your gains. Understanding if the price is actually breaking out or just faking strength can drastically change trading results. In this guide, we’ll learn how to identify this difference and master it once and for all.
What Are Breakouts?
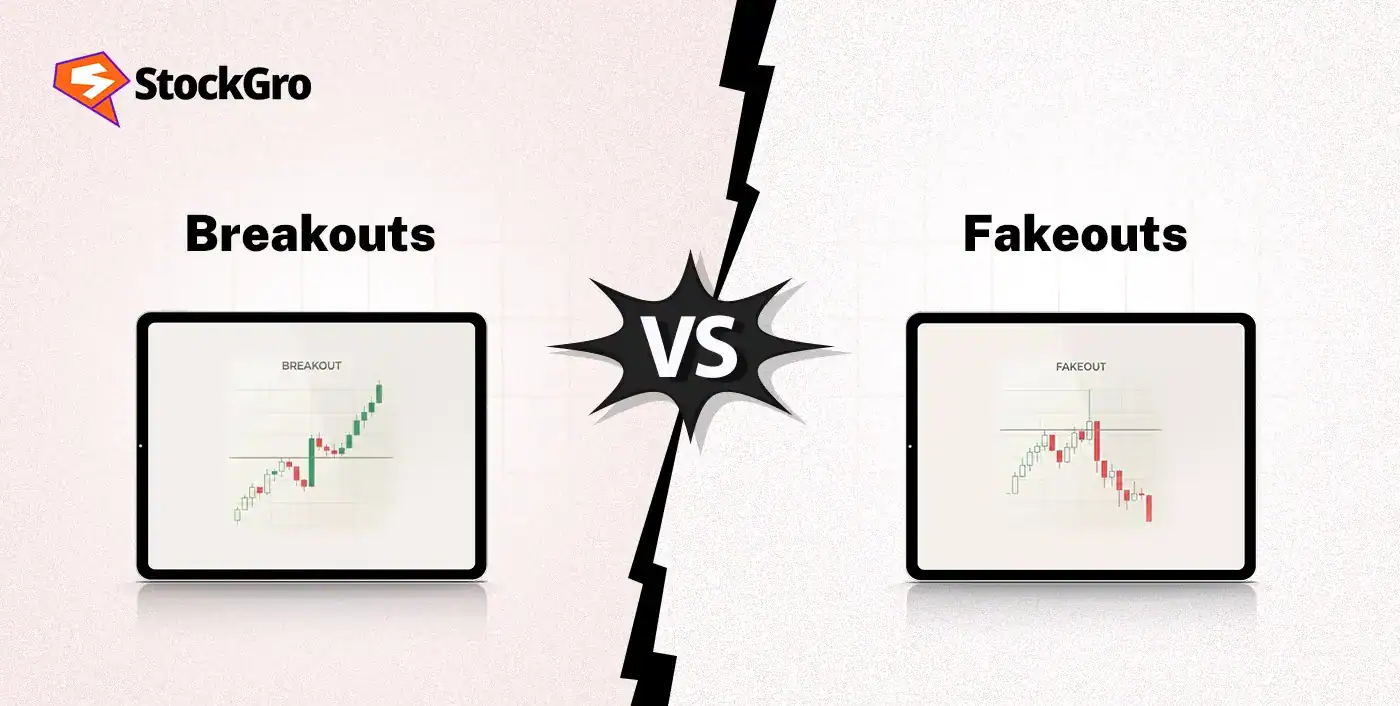
A breakout happens when the price moves beyond key support or resistance levels and continues to follow that momentum. They mark the beginning of new trends as they signal a shift in the supply and demand dynamics.
Breakouts are powerful because they often start sustained price movement. The longer the price holds in a range, the stronger the breakout.
Types of Breakouts
The two kinds of breakouts are:
Continuation Breakout: This breakout happens in an already existing trend. The market moves, pauses, and then continues in the same direction.
For example, a stock rising from ₹800 to ₹950 may consolidate between ₹930 and ₹950. When it breaks above ₹950 with strong momentum, the prior uptrend continues.
Reversal Breakout: When a trend breaks out in the opposite direction of the previous trend, it is called a reversal breakout. It reflects exhaustion of the previous trend.
Suppose a stock has been falling from ₹1,200 to ₹900 and repeatedly fails near ₹950. If it finally closes above ₹950 with strong volume and buying pressure, that can mark the beginning of a new uptrend.
Why do Breakouts happen?
A breakout is attributed to the following factors:
- Strong Participation: High volume is a reflection of buying or selling interest. When more participants support the move, a breakout is likely to continue.
- Pattern Completion: Breakouts often occur in patterns. When a pattern like a triangle or a rectangle is completed, the price breaks out from its earlier range.
- Market Sentiment: The outlook of investors can also cause a breakout. An optimistic view can result in the price breaking resistance, and vice versa.
- News and Events: Earnings reports, policy changes, or economic data can lead to breakouts by inviting more buyers and sellers based on the news.
What Are Fakeouts?
When the price breaks the key support and resistance, but fails to sustain and reverse back to the price range, it is known as a fakeout (or a false breakout). Instead of a genuine shift, it reflects a temporary imbalance or liquidity grabbing.
Fakeouts are dangerous because they can create an illusion of strength. This can trap the traders and result in unwanted entry or exit positions.
Why do Fakeouts happen?
Traders should monitor the given reasons behind fakeouts to avoid falling into traps.
- No Catalyst: Without any news or event that supports the move, the breakout fails to sustain, and the price quickly drops back.
- Lack of Volume: If the breakout happens without high participation, it means that there isn’t enough volume to continue the move forward, resulting in a fakeout.
- Stop Hunting: Institutional investors and big traders outsmart others by pushing the prices just enough to trigger the stop-loss and then move away with the profits. It leads to the price settling down to the previous levels.
- Overcrowding: When everyone is anticipating a breakout, it can make the trade setups more exposed and make the market move against the crowd’s expectations.
Breakouts vs Fakeouts: Key Differences
When price breaks a level, it can look promising, but not every move is real. Here are the important differences that help you quickly decide whether you’re seeing strength or a trap.
Support vs Resistance Behavior
The behaviour of support and resistance also has a vital role.
In a genuine breakout, the old resistance becomes the new support level. Or the old support turns into the new resistance. The price is aligned with the new levels and stays above or below them, marking the shift in momentum.
The price fails to hold beyond the support or resistance in the case of a fakeout. After breaking, the price slips back inside the range, proving the lack of conviction and that the existing price structure is still dominating the market.
Volume Confirmation & Momentum
During a breakout, the volume expands beyond the recent averages. Indicators like the MACD or RSI align with the move, confirming the momentum and the directional strength.
In a fakeout, the volume is low and inconsistent. The momentum indicators also point towards fading strength, meaning the breakout does not have any real support.
Retest & Close Confirmation
The price closes significantly beyond the previous zones in a breakout. It also successfully holds in retests, contributing to movement in the same direction.
In a fakeout, the closing price appears indecisive. During the retest, it fails to hold the level and reverses back to the earlier zones.
Signs of a true Breakout
Identifying a true breakout can be tricky. You can look for these signs that add more context.
- Volume Support
A true breakout needs backing from high volume. More participation shows higher conviction and the continuation of the breakout. - Confirmation From Indicators
Look for technical analysis tools like RSI and MACD. They add validity to the move and strengthen the breakout. - Closing Price
Where the price closes at the end of the trading session is very important. If there is a significant gap between the closing price and the breakout zone, it means the momentum is strong, and there are fewer chances of a reversal. - Macro Event Backing
Regulatory shifts, positive news, or good earnings make the breakout more reliable and support its continuation.
Red flags that signal a Fakeout
Getting stuck in a fakeout can be avoided when seen through a lens that helps in identifying the red flags.
- Low Volume
A breakout taking place with fewer buyers or sellers shows weak conviction and the likelihood of a reversal. - Reversal Next Candle
If, after a price break, the next candle forms in the opposite direction, it is a classic sign that the breakout was a fake one. - Divergence
When the breakout moves in one direction, but technical indicators show divergence, it means that the move won’t last for long. - No Clarity
If the breakout happens without a clear reason or catalyst behind it, it is better to proceed with caution, as the price spike can fail to sustain.
Technical Indicators and Strategies for Real Breakouts
Understanding a breakout is one thing, but trading with it is another. You can benefit from the indicators and strategies given below:
Volume Indicators
The volume indicators help in understanding the level of participation. When price moves beyond support or resistance, rising volume suggests strong buying or selling interest. A breakout without volume to support it often fails.
You can use tools like volume bars, volume moving averages, or On-Balance Volume (OBV) to measure the conviction.
Example: A stock breaks above ₹500, and its average daily volume is 10 lakh shares. On the breakout day, the volume surges to 20 lakh shares. This indicates that there is strong participation and a higher chance that the trend will continue.
Trendlines & Channels
When price consistently respects a rising or falling trendline, it reflects an established direction. A breakout above a falling trendline or below a rising trendline can signify a meaningful momentum shift. The more the price is aligned with the trendline, the stronger the following breakout.
Example: A stock trading in a downward channel between ₹700 and ₹620 breaks above the upper line at ₹705. If it closes at ₹720 and continues higher in the next session, the breakout suggests a trend change.
Volatility Indicators (ATR, Bollinger)
Volatility indicators measure the strength of price expansion. A genuine breakout occurs when volatility expands after a tight range, indicating strong momentum.
The Average True Range (ATR) shows how much the prices move daily, helping in understanding the routine volatility.
Bollinger Bands aid in identifying overbought or oversold conditions by showing how much the price is compressing or expanding.
Example: The shares of ABC Ltd. are trading at ₹300 with an ATR of ₹5. The price jumps to ₹330, and the ATR also rises sharply, signaling volatility expansion. In this scenario, if the Bollinger bands start to widen, it means the upward price movement is likely to follow.
Entry & Exit Rules
Entry Rule:
Wait for confirmation of the breakout before taking an entry. Check the second candle to determine its strength. Retesting will also help in assessing whether the momentum holds up or not. Entering after these checks helps in avoiding traps.
For example, if price breaks over ₹1,000 and closes at ₹1,020 with strong volume, enter near ₹1,025 after confirmation that ₹1,000 holds as support.
Exit Rule:
You should have a clear exit plan before entering the trade. Use the risk-reward ratio and place a stop-loss to protect against unfavourable price moves. Take an exit when your target is achieved or close to the major support or resistance areas.
For example, if you enter at ₹1,025, place a stop-loss at ₹995 and target ₹1,100. This creates a structured trade with controlled risk and clear profit potential.
Stop‑Loss & Risk Management
Risk management protects traders from false breakouts. Placing the stop-loss slightly beyond the breakout level helps in limiting losses while allowing room for small pullbacks. One should also keep their position sizes under control, as even strong setups have the possibility to fail.
Example: If you’re entering at ₹600 after a breakout, placing the stop-loss at ₹580 helps in limiting the risk to ₹20 per share. Setting the target at ₹660 is also justified as it is a favourable risk-reward ratio of 1:3.
Using Multi‑Timeframe Confirmation
The breakout becomes more credible with multiple timeframes. A breakout on a smaller timeframe becomes more credible when aligned with higher timeframe trends.
Traders also check daily and weekly charts to see whether the breakout is not facing stronger high-level resistance.
Example: A stock breaks out at ₹450 on the 1-hour chart. If the stock has already broken resistance at around ₹445 in the daily chart, it means the breakout is sustainable, and the chances of reversal are minimal.
Conclusion
Every trader encounters breakouts and fakeouts. The key is not the accurate prediction of every move but the ability to identify them and take positions accordingly.
With the help of technical indicators and predefined entry and exit rules, one can avoid getting stuck in trading traps. In the long run, consistency and discipline separate profitable traders from reactive ones.
Markets don’t just move – they test, trap, and tempt traders at every key level. One price swing can spark excitement, while another can wipe out your gains. Understanding if the price is actually breaking out or just faking strength can drastically change trading results. In this guide, we’ll learn how to identify this difference and master it once and for all.
What Are Breakouts?
A breakout happens when the price moves beyond key support or resistance levels and continues to follow that momentum. They mark the beginning of new trends as they signal a shift in the supply and demand dynamics.
Breakouts are powerful because they often start sustained price movement. The longer the price holds in a range, the stronger the breakout.
Types of Breakouts
The two kinds of breakouts are:
Continuation Breakout: This breakout happens in an already existing trend. The market moves, pauses, and then continues in the same direction.
For example, a stock rising from ₹800 to ₹950 may consolidate between ₹930 and ₹950. When it breaks above ₹950 with strong momentum, the prior uptrend continues.
Reversal Breakout: When a trend breaks out in the opposite direction of the previous trend, it is called a reversal breakout. It reflects exhaustion of the previous trend.
Suppose a stock has been falling from ₹1,200 to ₹900 and repeatedly fails near ₹950. If it finally closes above ₹950 with strong volume and buying pressure, that can mark the beginning of a new uptrend.
Why do Breakouts happen?
A breakout is attributed to the following factors:
- Strong Participation: High volume is a reflection of buying or selling interest. When more participants support the move, a breakout is likely to continue.
- Pattern Completion: Breakouts often occur in patterns. When a pattern like a triangle or a rectangle is completed, the price breaks out from its earlier range.
- Market Sentiment: The outlook of investors can also cause a breakout. An optimistic view can result in the price breaking resistance, and vice versa.
- News and Events: Earnings reports, policy changes, or economic data can lead to breakouts by inviting more buyers and sellers based on the news.
What Are Fakeouts?
When the price breaks the key support and resistance, but fails to sustain and reverse back to the price range, it is known as a fakeout (or a false breakout). Instead of a genuine shift, it reflects a temporary imbalance or liquidity grabbing.
Fakeouts are dangerous because they can create an illusion of strength. This can trap the traders and result in unwanted entry or exit positions.
Why do Fakeouts happen?
Traders should monitor the given reasons behind fakeouts to avoid falling into traps.
- No Catalyst: Without any news or event that supports the move, the breakout fails to sustain, and the price quickly drops back.
- Lack of Volume: If the breakout happens without high participation, it means that there isn’t enough volume to continue the move forward, resulting in a fakeout.
- Stop Hunting: Institutional investors and big traders outsmart others by pushing the prices just enough to trigger the stop-loss and then move away with the profits. It leads to the price settling down to the previous levels.
- Overcrowding: When everyone is anticipating a breakout, it can make the trade setups more exposed and make the market move against the crowd’s expectations.
Breakouts vs Fakeouts: Key Differences
When price breaks a level, it can look promising, but not every move is real. Here are the important differences that help you quickly decide whether you’re seeing strength or a trap.
Support vs Resistance Behavior
The behaviour of support and resistance also has a vital role.
In a genuine breakout, the old resistance becomes the new support level. Or the old support turns into the new resistance. The price is aligned with the new levels and stays above or below them, marking the shift in momentum.
The price fails to hold beyond the support or resistance in the case of a fakeout. After breaking, the price slips back inside the range, proving the lack of conviction and that the existing price structure is still dominating the market.
Volume Confirmation & Momentum
During a breakout, the volume expands beyond the recent averages. Indicators like the MACD or RSI align with the move, confirming the momentum and the directional strength.
In a fakeout, the volume is low and inconsistent. The momentum indicators also point towards fading strength, meaning the breakout does not have any real support.
Retest & Close Confirmation
The price closes significantly beyond the previous zones in a breakout. It also successfully holds in retests, contributing to movement in the same direction.
In a fakeout, the closing price appears indecisive. During the retest, it fails to hold the level and reverses back to the earlier zones.
Signs of a true Breakout
Identifying a true breakout can be tricky. You can look for these signs that add more context.
- Volume Support
A true breakout needs backing from high volume. More participation shows higher conviction and the continuation of the breakout. - Confirmation From Indicators
Look for technical analysis tools like RSI and MACD. They add validity to the move and strengthen the breakout. - Closing Price
Where the price closes at the end of the trading session is very important. If there is a significant gap between the closing price and the breakout zone, it means the momentum is strong, and there are fewer chances of a reversal. - Macro Event Backing
Regulatory shifts, positive news, or good earnings make the breakout more reliable and support its continuation.
Red flags that signal a Fakeout
Getting stuck in a fakeout can be avoided when seen through a lens that helps in identifying the red flags.
- Low Volume
A breakout taking place with fewer buyers or sellers shows weak conviction and the likelihood of a reversal. - Reversal Next Candle
If, after a price break, the next candle forms in the opposite direction, it is a classic sign that the breakout was a fake one. - Divergence
When the breakout moves in one direction, but technical indicators show divergence, it means that the move won’t last for long. - No Clarity
If the breakout happens without a clear reason or catalyst behind it, it is better to proceed with caution, as the price spike can fail to sustain.
Technical Indicators and Strategies for Real Breakouts
Understanding a breakout is one thing, but trading with it is another. You can benefit from the indicators and strategies given below:
Volume Indicators
The volume indicators help in understanding the level of participation. When price moves beyond support or resistance, rising volume suggests strong buying or selling interest. A breakout without volume to support it often fails.
You can use tools like volume bars, volume moving averages, or On-Balance Volume (OBV) to measure the conviction.
Example: A stock breaks above ₹500, and its average daily volume is 10 lakh shares. On the breakout day, the volume surges to 20 lakh shares. This indicates that there is strong participation and a higher chance that the trend will continue.
Trendlines & Channels
When price consistently respects a rising or falling trendline, it reflects an established direction. A breakout above a falling trendline or below a rising trendline can signify a meaningful momentum shift. The more the price is aligned with the trendline, the stronger the following breakout.
Example: A stock trading in a downward channel between ₹700 and ₹620 breaks above the upper line at ₹705. If it closes at ₹720 and continues higher in the next session, the breakout suggests a trend change.
Volatility Indicators (ATR, Bollinger)
Volatility indicators measure the strength of price expansion. A genuine breakout occurs when volatility expands after a tight range, indicating strong momentum.
The Average True Range (ATR) shows how much the prices move daily, helping in understanding the routine volatility.
Bollinger Bands aid in identifying overbought or oversold conditions by showing how much the price is compressing or expanding.
Example: The shares of ABC Ltd. are trading at ₹300 with an ATR of ₹5. The price jumps to ₹330, and the ATR also rises sharply, signaling volatility expansion. In this scenario, if the Bollinger bands start to widen, it means the upward price movement is likely to follow.
Entry & Exit Rules
Entry Rule:
Wait for confirmation of the breakout before taking an entry. Check the second candle to determine its strength. Retesting will also help in assessing whether the momentum holds up or not. Entering after these checks helps in avoiding traps.
For example, if price breaks over ₹1,000 and closes at ₹1,020 with strong volume, enter near ₹1,025 after confirmation that ₹1,000 holds as support.
Exit Rule:
You should have a clear exit plan before entering the trade. Use the risk-reward ratio and place a stop-loss to protect against unfavourable price moves. Take an exit when your target is achieved or close to the major support or resistance areas.
For example, if you enter at ₹1,025, place a stop-loss at ₹995 and target ₹1,100. This creates a structured trade with controlled risk and clear profit potential.
Stop‑Loss & Risk Management
Risk management protects traders from false breakouts. Placing the stop-loss slightly beyond the breakout level helps in limiting losses while allowing room for small pullbacks. One should also keep their position sizes under control, as even strong setups have the possibility to fail.
Example: If you’re entering at ₹600 after a breakout, placing the stop-loss at ₹580 helps in limiting the risk to ₹20 per share. Setting the target at ₹660 is also justified as it is a favourable risk-reward ratio of 1:3.
Using Multi‑Timeframe Confirmation
The breakout becomes more credible with multiple timeframes. A breakout on a smaller timeframe becomes more credible when aligned with higher timeframe trends.
Traders also check daily and weekly charts to see whether the breakout is not facing stronger high-level resistance.
Example: A stock breaks out at ₹450 on the 1-hour chart. If the stock has already broken resistance at around ₹445 in the daily chart, it means the breakout is sustainable, and the chances of reversal are minimal.
Conclusion
Every trader encounters breakouts and fakeouts. The key is not the accurate prediction of every move but the ability to identify them and take positions accordingly.
With the help of technical indicators and predefined entry and exit rules, one can avoid getting stuck in trading traps. In the long run, consistency and discipline separate profitable traders from reactive ones.