Spotting the right moment to enter a trade is never easy, and relying on price alone can make it even more confusing, especially when the market keeps swinging. Bullish RSI divergence offers a way to cut through that noise. It highlights early signs that the selling pressure is fading and that a potential upward move may be forming, even before the price begins to recover.
In this guide, you’ll learn what bullish divergence actually means, why it forms, how to read it on the chart, and how it can be used alongside other tools to make more confident decisions.
What is Bullish Divergence in RSI?
A bullish divergence in RSI happens when the price continues to make newer lows, but the RSI indicator forms newer highs. Their opposite movement indicates that sellers are weakening, and an upward trend is about to begin.
The divergence shows the shift of momentum before the price candles can show it. This helps in early identification of reversals and can be used to take a trade position.
How the RSI Indicator Works
Before making sense of divergence, it helps to know what RSI is doing underneath. The indicator tries to capture the force behind a price move rather than just the move itself.
RSI moves on a scale from 0 to 100, and different regions on the scale tell a different story:
- Above 70: When RSI climbs past this point, the market usually feels stretched, almost like buyers are starting to tire out.
- Below 30: In this area, selling pressure tends to fade and the chance of a bounce becomes stronger.
The most common version of the indicator uses a 14-period calculation, enough to smooth out noise while still reacting to changes in momentum.
Why Bullish Divergence Indicates a Reversal
Bullish divergence highlights a shift in market strength before the trend change actually takes place. During a downtrend, both price and RSI fall together, but divergence breaks this pattern when:
- Price makes a fresh low.
- RSI refuses to follow and makes a high.
This opposite movement means that:
1. Sellers are losing strength
Even though the price touches a new low, RSI is rising, telling you that sellers no longer have strong momentum.
2. Buyers are stepping in quietly
The higher low on RSI reflects that buying pressure is increasing, even though the price still looks bearish.
3. Higher possibility of reversal
As momentum shifts, you may see a trend change triggered by a surge in fresh buying, confirming the reversal.
Types of Bullish Divergence
Bullish divergence comes in two forms, and now we’ll go through each one so you can understand them easily.
Regular Bullish Divergence
The Regular Bullish Divergence helps you detect a trend reversal. It happens when:
- The prices make a lower low.
- RSI forms a higher low.
It means that the downtrend is weakening, and a reversal uptrend is more likely to happen. Regular divergence is ideal for traders looking to enter reversals at attractive price points.
Hidden Bullish Divergence
Hidden Bullish Divergence in catching opportunities in an existing uptrend. It appears when:
- The price is making higher lows.
- RSI is having a lower low.
It tells us that the trend is still strong and the pushback is temporary. If you prefer trading with the trend, hidden divergence gives you better entries.
How to Identify Bullish Divergence on a Chart
1. Identify swing lows
Make sure the second swing low on the price chart is lower than the first.
2. Check RSI lows
See whether RSI creates a higher low at the same points.
3. Compare
Check if the price is downward and the RSI is moving upwards. This opposite direction confirms that divergence is forming.
4. Confirm strength
The setup becomes more reliable when:
- The RSI moves toward the oversold region.
- The pattern appears near a known support level.
When these come together, the chances of the setup working out are much higher.
Step-by-Step Chart Example of Bullish Divergence
This HDFC Bank chart from June 2022 shows a clear bullish divergence setup using the RSI indicator.
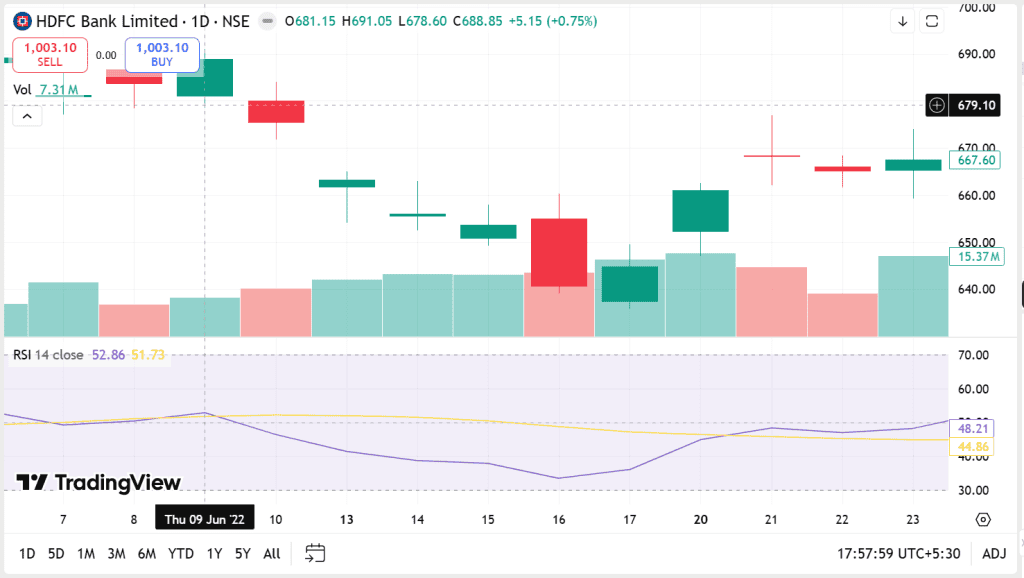
1. Open the chart
Open the daily chart of HDFC Bank on TradingView and add the RSI (14) indicator.
2. Identify the downtrend
The price keeps slipping through early and mid-June, and you can see a short-term downtrend forming on the chart.
3. Mark the first swing low
Around 10th June, the price creates its first swing low, and RSI also dips at this point.
4. Mark the second swing low
On 16th June, the price fell again and formed a lower low, showing continued selling pressure.
5. Compare the RSI lows
Even though price makes a lower low, RSI makes a higher low, which is the key sign of bullish divergence.
6. Look for a confirmation candle
After the divergence, a bullish candle is formed, which confirms the shift in momentum and shows that buyers are starting to take control.
7. Observe the reversal
After the confirmation, the price begins to climb steadily, giving an early hint of a reversal before the charts can show it.
Best RSI Settings for Bullish Divergence
Choosing the right RSI settings enhances both your accuracy and your confidence.
RSI 14
It is the most balanced setting and works well for swing and positional trades, while also filtering out market noise.
RSI 9
This setting uses 9 periods to give early signals. It is more sensitive to reversals, but it may also produce more false alerts.
RSI 21
This setting works great for long-term charts, smooths out price fluctuations, and suits investors or positional traders.
For most traders, RSI 14 is the best starting point.
Timeframes for Bullish Divergence Trading
You can spot bullish divergence almost anywhere on the chart, though how reliable it is changes with the timeframe:
- Ultra Short (1min – 15min): These charts throw out a lot of divergence signals, but many of them are just noise, so they can be tricky to trust.
- Intraday: These tend to work better for tracking movement in a single trading session and usually highlight cleaner, medium-strength shifts during the day.
- Daily: A comfortable zone for swing setups – steady enough to be dependable, yet active enough to offer regular chances.
- Monthly / Weekly: These larger timeframes rarely rush, but when they print a divergence, it often points to a serious change in trend.
In general, the best results come from choosing a timeframe that matches how you prefer to trade.
Trade Entry Strategy Using Bullish Divergence
Bullish divergence becomes far more reliable when you use a structured entry plan. The common types of trade entries are:
1. Breakout Entry
A breakout entry is used when the price moves above the previous swing high or forms a clear bullish pattern, showing that buyers are stepping in with strength.
2. Support-Based Entry
A support-based entry works well when bullish divergence appears near a known support level, because support increases the chance that the price will bounce upward, making your entry safer.
3. Candle Confirmation Entry
A candle-based entry simply waits for a bullish sign to appear on the chart like a bullish harami or an engulfing pattern, because those candles often hint that buyers are starting to push back a little.
Stop-Loss and Target Placement
Risk management keeps your money safe, especially when the market is reversing.
Stop-Loss Placement
Set stop-loss:
- Below the second swing low, so the trade closes if the market keeps falling.
- Below a strong support zone to protect the trade under an important level.
Reversal trades often need slightly higher stop-loss levels because the market can move quickly.
Target Placement
Targets can be set using:
- The previous swing highs are common points where the price may stop rising.
- Resistance areas, where the market has turned around before.
- Moving averages often behave like little barriers when the price climbs—they can slow the move, or sometimes stop it altogether.
Targets make more sense when they match the broader trend and the actual strength behind the move, not just the candle you’re staring at.
Confirmation Techniques for Higher Accuracy
Using extra confirmation tools isn’t about being fancy; it simply helps cut out the weaker setups. With a few solid checks in place, the decision to take a trade feels a lot clearer and less forced.
RSI + MACD Confirmation
MACD often works well with RSI when you’re trying to read momentum. Look out for:
- When the MACD histogram slips into positive territory, it’s often the first quiet hint that buyers are waking up again, even if the chart hasn’t made it obvious.
- And when the MACD line finally pushes above the signal line, the move starts leaning upward.
- And if this lines up with an RSI divergence, the hint of a reversal becomes much more convincing.
When both indicators align, your entry becomes far stronger.
RSI + Moving Average Confirmation
Moving averages can give small hints about where the trend might be heading, though they don’t shout it out.
- When the price finally closes above the short EMA, it’s often the first little sign that some strength is coming back.
- If that same EMA starts bending upward instead of drifting flat, the short-term momentum is improving
- And when the price climbs back over the long-term EMA, it’s as if the medium-term trend stops fluctuating and gets steady.
They don’t remove all the confusion, but moving averages do help cut through the noise and make the direction a bit easier to read.
Bullish Divergence with Support Levels
If divergence forms near support, the setup becomes significantly more reliable. Useful support zones include:
- Horizontal support, which acts as a clear price floor where buying pressure has appeared before.
- Demand zones, where strong accumulation in the past increases the chance of a fresh reversal.
- Moving average support, which provides a dynamic level at which the price often stabilises.
When divergence is combined with strong support, it leads to powerful and sustained reversals.
Common Mistakes When Trading Bullish Divergence
Beware of these mistakes when you’re trading bullish divergence:
1. Entering before confirmation
Divergence is just a signal, not a confirmation of trend change. It’s usually better to wait for confirmation with other signals before taking the trade.
2. Ignoring the timeframes
If the bigger trend is still strongly bearish, a small bullish divergence may not work. Checking the higher timeframe helps you avoid trading against major market directions.
3. Forcing the divergence
Looking for a divergence even when the chart doesn’t actually show it is a common mistake. Always use clear lows on both price and RSI to avoid misleading signals.
4. Skipping stop-loss
Reversal trades can be unpredictable, so a proper stop-loss is essential. It protects your capital if the market moves the other way.
Conclusion
A bullish divergence in RSI is often a quiet sign that a downtrend may be slowing. It appears when the price drops to a new low, but the RSI doesn’t fall with it and instead turns slightly upward. This difference hints that selling pressure isn’t as strong as it looks. When this pattern is viewed together with other clues like MACD, moving averages, or changes in volume, the chance of a reversal becomes easier to spot. Many people use this kind of setup in different markets to judge when a trend might turn and to find safer entry points.
FAQs
A bullish divergence is spotted when the price makes a lower low, but RSI forms a higher low at the same swing points. This signals weakening selling pressure and hints that a reversal may be forming even before the price shows strength.
Daily and weekly charts work best because they filter noise and highlight strong, meaningful reversals. Intraday charts like 1H or 4H can also be used, but may create more false signals.
RSI divergence is a fairly accurate indicator, but it becomes more efficient when combined with confirmation tools.
MACD, moving averages, and key support zones provide strong confirmation and increase the probability of a successful reversal.