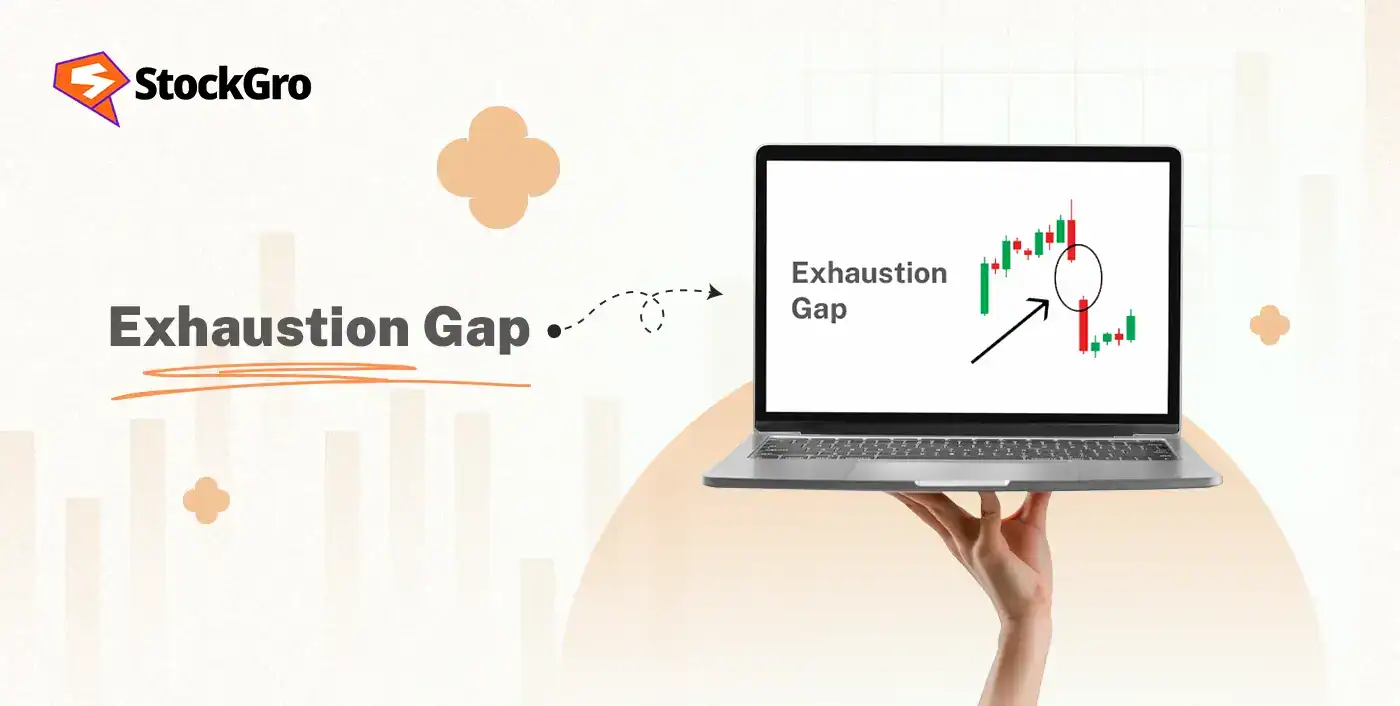
The candles race ahead, volume explodes, and price gaps away from its previous range. When that volume rush loses its strength, it signals market fatigue and marks a final move before a reversal, known as the Exhaustion Gap.
An Exhaustion Gap forms near the end of an existing trend, usually with high volume, and is followed by weak price action that hints at a reversal. The traders use it to anticipate turning points, plan short-selling or buying opportunities, and set entries with proper confirmation.
Understanding an Exhaustion Gap helps traders avoid entering when a trend is already dying and positions them early for the reversal that follows. It protects capital, sharpens timing, and keeps a trader from chasing that final, risky push of a tired trend.
To explore the Exhaustion Gap in detail, understand how they form, how to confirm them, and how to build a strategy around them, continue reading!
What Is an Exhaustion Gap?
An exhaustion gap is a trading signal that appears at the end of an existing strong price trend, up or down, and suggests a potential trend reversal. It is marked by a price gap between the previous close and the next opening, usually with a sharp rise in volume, and followed by a slowdown or reversal in the existing trend.
Meaning of Exhaustion Gap in Technical Analysis
An exhaustion gap in technical analysis signals that a trend has pushed to its limit. It appears near the end of a strong move, with a sudden price gap in the same direction, but the momentum quickly fades afterwards.
The high volume during this gap suggests aggressive last-minute buying or selling, while the weak follow-through hints that the trend is losing momentum. So, once this burst of energy is spent, the market usually shifts into reversal or pauses into consolidation, marking the beginning of a new direction.
How Exhaustion Gap Forms in Stock Charts
- Existing trend: The market is already in a strong uptrend or downtrend, but the volume slowly fades, hinting that this chart pattern may be near exhaustion.
- The gap: After the trend has been moving aggressively, a gap appears in the direction of the trend. This is the final push by the last-minute buyers or sellers who are exhausted from the move.
- High volume: The gap-up or gap-down is accompanied by a higher trading volume than the average, indicating intense, but ultimately unsustainable activity.
- Price failure: The price fails to continue moving in the direction of the gap. So, instead, it reverses, consuming the gap and reversing the trend.
Exhaustion Gap vs Breakaway Gap vs Runaway Gap
| Feature | Exhaustion Gap | Breakaway Gap | Runaway Gap |
| Location | It forms near the end of an existing trend | It forms at the beginning of a new trend, breaking out of a trading range | It appears in the middle of an established, strong trend |
| Signal | It signals the end of the current trend and a likely upcoming reversal | It signals the start of a strong new trend and a significant shift in market sentiment | It signals the continuation of the current trend |
| Volume | It is accompanied by a sharp spike in volume, followed by a decrease in momentum | It is accompanied by a sharp increase in volume as the price breaks out of support or resistance | Volume remains strong, though not always as intense as exhaustion or breakaway gaps |
| Filling the gap | It is most likely to be filled as the prices reverse and retrace the gap area | It is less likely to be filled, as the new trend continues with strength | It is unlikely to be filled due to an existing directional momentum |
How to Identify an Exhaustion Gap (Key Signs)
- Shows up at the end of a strong move: The gap appears after a lasting rally or drop, hinting that the trend is running on its final push.
- Opens with a noticeable jump in volume: The volume surges as late traders rush in, usually driven by emotion rather than fresh strength.
- Momentum fades right after the gap: The candles start getting smaller, or fail to extend in the same direction, signalling that the trend has hit a wall.
- Price starts reversing or slows into a range: So, instead of continuing, the market pulls back or pauses, confirming that the trend has burned out.
Volume Confirmation in Exhaustion Gap
- High volume on gap day: The gap up, for a bearish reversal, or gap down, for a bullish reversal, is accompanied by an unusually high trading volume, representing the final, intense surge in either buying or selling pressure.
- Rapid gap fill: The price quickly moves to close the gap, reversing the direction of the original trend, which further confirms the reversal.
- Decreasing volume afterwards: When the reversal kicks in, the hype fades, and volume cools off, showing that the earlier surge was just a final burst, not the start of something new.
Candle Patterns to Validate Exhaustion Gaps
The candlestick patterns that confirm momentum is fading and a reversal is likely are:
- Doji or Spinning Top: These are small-body candles that show neither side is winning, after a long trend, which hints that the trend is about to flip.
- Shooting Star: It is seen at the top of an uptrend, it comes with a tiny body and a long upper shadow. The buyers push the price up, but sellers slam it right back down, signalling weakness ahead.
- Bearish Engulfing: It is a strong red candle that completely takes over a smaller green one from the previous session, which shows the sellers are stepping in with force, cutting the uptrend short.
- Evening Star: It involves a three-step reversal, a big bullish candle, a pause or hesitation, and then a strong bearish close, which reflects fading buying power and the market handing control to the sellers.
Exhaustion Gap Trading Strategy
An exhaustion gap is the final stretch of a strong trend, and in intraday trading strategies, traders prepare for the reversal instead of chasing it.
- Identifying the trend and the gap: The traders start with tracking a strong rally or decline, then watch for a large gap in the same direction with unusually high volume.
- Confirming the reversal: They wait for the price to fill that gap and look for reversal candles, while a fading volume signals that the move has lost power.
- Entering the trade: The buyers step in after a bullish candle confirms a reversal, while the short-sellers act once a bearish candle confirms a breakdown from the gap.
- Setting stop-loss and targets: The risk is controlled by placing stops beyond the recent swing highs or lows, while the targets are planned around support or resistance levels.
- Exiting the trade: The traders close the positions if the reversal fails, a stop hits, or the target is done, no emotions, just rules.
Exhaustion Gap for Short Selling & Swing Trading
The exhaustion gaps can help in identifying reversals for both short selling and swing trading. In a bearish setup, the gap appears at the end of an uptrend, showing buyer fatigue. The traders wait for the price to fail at new highs and enter after a strong bearish breakdown, placing stops above the gap candle and targeting at least the gap fill.
In a bullish swing setup, the gap forms at the end of a downtrend as the selling pressure fades. The traders enter after a bullish confirmation of the gap, secure stops below the gap candle, and target the gap fill or a larger trend reversal.
Stop-Loss & Take-Profit Placement for Exhaustion Gaps
The stop-loss is the safety net in an exhaustion gap setup, acting as risk management when the reversal doesn’t play out. In a bearish setup after an upward exhaustion gap, the traders might keep the stop just above the gap’s high. If the price moves back above that point, it signals that the buyers are still in control and the trend may continue. In a bullish setup after a downward exhaustion gap, the stop might be placed below the gap’s low, because a drop beneath it shows the sellers are still dominant.
The take-profit targets usually aim for a gap fill, where the price returns to the previous day’s close. That level marks the start of the final push that exhausted the trend. The traders might go beyond this and set targets based on stronger risk-reward ratios or trail profits if the new trend gains momentum.
Example Chart of Exhaustion Gap
Here’s an example of how the exhaustion gap chart patterns appears in a chart:
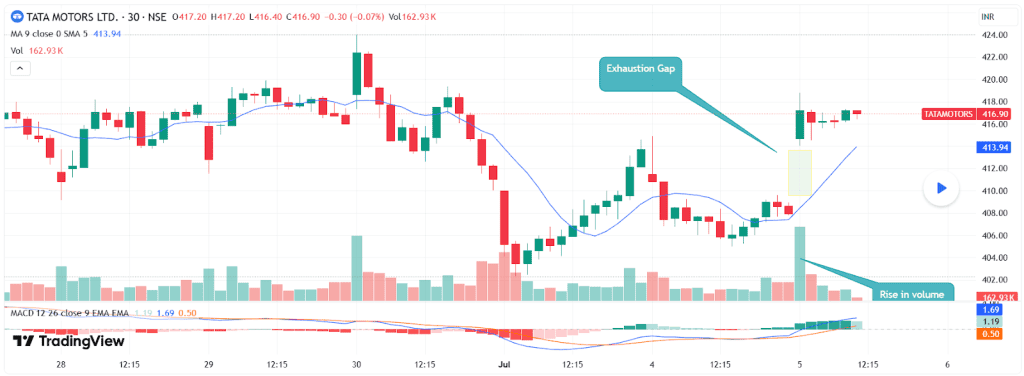
On 5 July 2022, Tata Motors Ltd., an exhaustion gap appeared after a steady downtrend. The price opens sharply higher, leaving a visible gap and forming a bullish candle with rising volume. As the earlier selling pressure weakens, buyers step in and push the trend to reverse. The move signals the end of the decline and the start of a fresh upward swing.
Common Mistakes Traders Make
- Entry & Timing: The traders might rush in without confirming the gap, or wait too long and lose the edge. They might even ignore the overall market mood and get trapped.
- Risk Management: The traders might skip stop-loss, go heavy on leverage, or forget support/resistance. That’s how one bad move snowballs into losses.
- Analysis & Planning: The traders might misread volume, let emotions drive trades, or forget the bigger trend, which turns into a costly mistake.
Best Timeframe to Trade Exhaustion Gaps
The exhaustion gaps can be traded across all timeframes,
- Daily Charts: This is a practical timeframe for identifying exhaustion gaps. The gap appears between a day’s close and the next day’s open, driven by significant news or a final surge of investor activity.
- Weekly or Monthly Charts: The gaps on these longer timeframes are rare but can signal very significant and longer-lasting trend reversals.
- Intraday Charts: These gaps appear frequently on shorter timeframes, but are less reliable and reflect normal market volatility. The day traders might use 1-minute or 5-minute charts to time their entries and exits after the initial market opens.
Exhaustion Gap Scanner / Tools
The stock market AI tools like Stoxo can assist in identifying exhaustion gaps by providing AI-driven insights that combine volume analysis and technical tools.
Stoxo makes identifying exhaustion gaps way easier by reading price action, volume shifts, and momentum in real time. It cuts the manual chart-hunting and helps the traders to catch trend reversals.
There are other scanners online, too, but Stoxo works well for beginners who want clean data without doing detective work on every chart.
Conclusion
The exhaustion gap shows up when a trend is almost out of energy. It appears with a sharp gap and heavy volume, followed by weak price action and a reversal. If the traders read it right, it helps to avoid chasing dying trends, improves entries, protects capital, and supports smarter swing or short-selling opportunities.
FAQ‘s
An exhaustion gap in technical analysis is a price gap that forms near the end of a strong trend with heavy volume, followed by weak movement and a reversal, signaling that the trend is losing strength.
The daily charts are considered useful, as the gaps form clearly between a day’s close and the next open. The weekly gaps are stronger but rare, while the intraday gaps are frequent but less reliable.
The traders might look for a large gap with high volume, followed by weak candles, gap filling, and reversal candles such as engulfing, doji, or shooting star.
An exhaustion gap appears near the end of a trend and signals a reversal, while a runaway gap forms in the middle of a trend, supporting continuation with strong momentum.
The RSI, volume analysis, and support-resistance levels help in confirming the weakness and improving timing. They show overbought or oversold conditions and validate the reversal.
It is reliable when confirmed with volume, gap filling, and reversal candles, and without proper confirmation, the trend can continue, causing losses.
An exhaustion gap can be both bullish or bearish. A gap at the end of an uptrend signals a bearish reversal, while a gap at the end of a downtrend signals a bullish reversal.