
The price behaviour, when observed over time, reflects certain patterns that are useful for interpreting the market direction. The Exponential Moving Average (EMA) Crossover is built on this particular principle of trend analysis.
In technical analysis, the recent price action is given a greater weightage, which allows the indicators such as EMA to respond faster to the market changes. Now, coming to our topic, an Exponential Moving Average (EMA) crossover occurs when a short-term, fast-moving EMA intersects a long-term, slow-moving EMA, signaling a potential trend reversal.
This aligns with the view that the prices move in trends and these trends can be identified through systematic chart analysis.
The following section involves a discussion regarding the Exponential Moving Average (EMA) crossover, the significance of commonly used combinations such as 10 EMA and 20 EMA, and the way these signals are applied in practical trading frameworks.
What is an Exponential Moving Average (EMA)?
An Exponential Moving Average (EMA), basically a moving average, is used to analyse price trends that assigns a greater weightage to the latest price data, which makes it react faster to current market movements.
Unlike a simple moving average, which treats all data points equally, EMA adjusts faster to the price changes and reflects short-term momentum more clearly.
What is Exponential Moving Average (EMA) Crossover?
In technical analysis, Exponential Moving Average (EMA) crossover is utilised in chart analysis for identifying shifts in market direction by comparing two moving averages calculated over separate time spans. Here,
- One average is shorter and reacts quickly to price changes,
- While the other is longer and moves more slowly.
The Significance of 10 EMA and 20 EMA
To apply EMA, two timeframes are compared to understand both immediate movement and the overall trend.
For instance, 10 EMA and 20 EMA are commonly used in short-term chart analysis to track immediate price direction and near-term trend strength. Their significance is as such:
- 10 EMA: This is a short-term average that responds quickly to the price movements. It helps in tracking immediate momentum and is usually used to identify early entry opportunities within an ongoing move.
- 20 EMA: This is a comparatively slower average that filters short-term price swings. It provides a clear view of the ongoing trend and is commonly used to confirm direction or assess potential exit zones.
The EMA Crossover: A Trading Signal
The EMA crossover takes place when the short-term and the long-term lines intersect each other.
- A “Golden Cross” (bullish) happens when the fast EMA crosses above the slow EMA, indicating that the recent prices are strengthening relative to the overall trend.
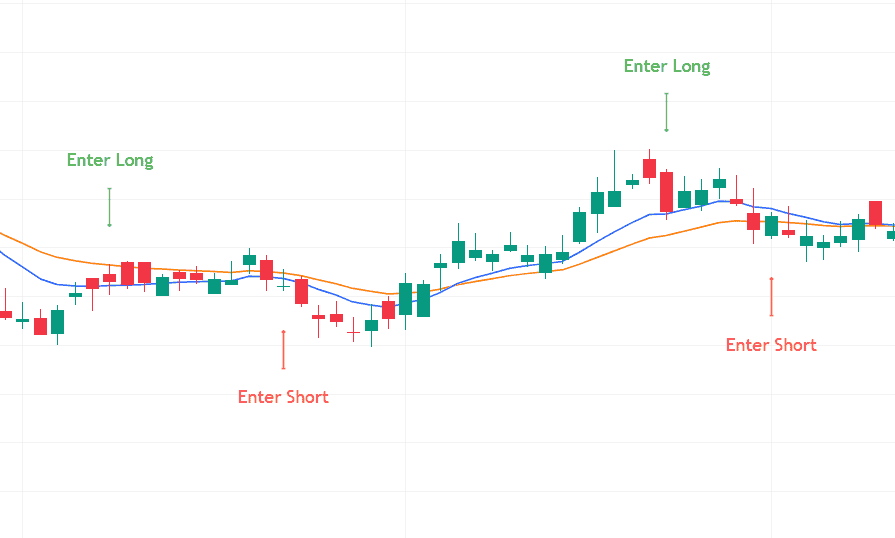
In this chart, the 10 EMA crosses above the 20 EMA, forming a bullish crossover, followed by the price sustaining above both averages, confirming upward momentum.
- A “Death Cross” (bearish) occurs when the shorter EMA falls below the longer EMA, suggesting that the recent prices are weakening.
In the following chart, the 10 EMA crosses above the 20 EMA, forming a bullish crossover. Here, the price sustained above both averages, confirming strengthening momentum and an emerging uptrend.
Traders usually read these crossovers in context to the current market trend, volume, and overall market condition.
Importance of EMA Crossover
The EMA Crossover helps organise price action into a readable trend structure. The traders use it to focus on meaningful shifts in the price trend, rather than reacting to every price move.
- Trend Identification: It highlights when the momentum begins to change, offering early signals of a possible reversal.
- Trend Confirmation: The position of the two EMAs helps in validating whether the trend is gaining strength or losing direction.
- Clear Price Action: By smoothing price data, it reduces minor fluctuations, allowing traders to concentrate on sustained moves rather than short-term noise.
How to Use the EMA Crossover Strategy
The following steps will guide you through how to use the EMA crossover strategy:
| Step–1 | Chart Preparation | Launch the desired chart, and apply two EMAs on the price chart, for example, 10 EMA and 20 EMA, to track short-term and near-term trends. |
| Step–2 | Identify the Signal | Identify the points where the 10 EMA intersects with the 20 EMA, as these crossings indicate a potential change in momentum. |
| Step–3 | Signal Validation | Evaluate the crossover in relation to overall trend, price behaviour, or supporting indicators before acting. |
| Step–4 | Trade Execution | Traders might initiate a buy position when the 10 EMA crosses above the 20 EMA, and a sell position when it crosses below. |
| Step–5 | Risk Control | They also use stop-loss levels around recent highs or lows to manage downside, as not all crossovers lead to sustained trends. |
A Practical Example
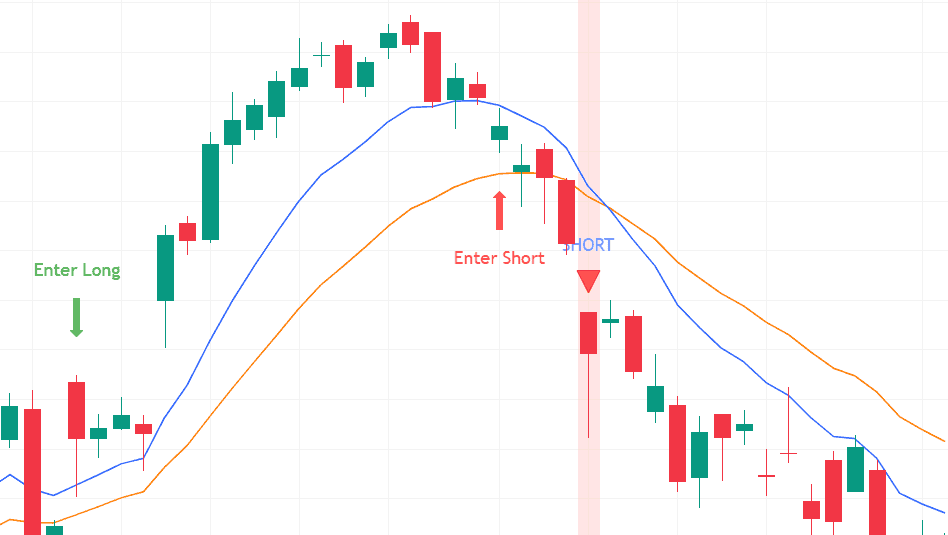
Consider a stock moving within a narrow range before gaining direction. As the momentum builds, the 10-EMA crosses over the 20-EMA, which indicates a shift in the upward price movement. This crossover provides a basis for entering a buy position.
As the trend develops, the price continues to hold above both averages, reinforcing the strength of the move. Later, when the 10-EMA turns lower and crosses below the 20-EMA, it reflects weakening momentum. This shift offers a signal to exit the position and protect gains.
Conclusion
The Exponential Moving Average (EMA) Crossover remains a widely followed method for identifying trend direction and momentum shifts. It offers a way of interpreting price action by understanding the relationship between short-term and long-term averages.
While it simplifies decision-making, its effectiveness improves when used alongside trend context, confirmation tools, and disciplined risk management in real market conditions.
FAQs
An EMA crossover occurs when a shorter-period EMA intersects with a longer-period EMA on a price chart. This interaction signals a potential change in market momentum. When the shorter EMA moves above the longer one, it indicates strength, while a move below suggests weakening price action and possible trend reversal.
The 9 and 21 EMA crossover strategy uses a faster 9-period EMA and a slower 21-period EMA to track short-term trends. When the 9 EMA crosses above the 21 EMA, it suggests upward momentum. When it crosses below, it signals weakness, helping traders identify potential entry and exit points.
The effectiveness of EMA crossovers depends on the trading style and timeframe. The short-term traders might prefer combinations like 9 and 21 or 10 and 20 for quicker signals, while longer-term traders may use wider gaps. The key is in consistency, confirmation, and aligning the crossover with the overall trend.