As a trader, you’ve probably had this moment: you spot a stock falling, do a trade, and the price bounces back. But if you weren’t able to exit this reversal, you will lose money. That’s where knowing patterns like the Falling Three Methods can save you from this.
This pattern could be seen during a downtrend, and it tells you that the sellers are still holding the dominance. Let’s see how the pattern helps traders know about this.
What is the Falling Three Methods Candlestick Pattern?
The Falling Three Methods is a bearish candlestick pattern that occurs during a downtrend. It signals that sellers are still in charge, even if there’s a short pause. You’ll see a big red candle, then some small ones going upward, and another big red candle.
How is the Falling Three Methods Pattern Formed? (add diagram)
The Falling Three Methods pattern is built with five candles which are as follows:
1. First candle: The pattern begins with a big red candle. It means it is a strong move down and confirms the price is already falling.
2. Middle three candles: Then come the three candles: small and green. These show the price climbing, but not with strength. They stay within the high and low of the first red candle.
3. Last candle: The last candle is a red one with a big size that breaks below the first candle’s closing price. It tells you the selling isn’t over yet, and the downtrend is ready to continue.
Psychology behind the Falling Three Methods
The stock is falling fast and the sellers are clearly showing their dominance. Then suddenly, a few green candles appear. But before you try to plan your trade, the price drops again. That’s what the Falling Three Methods pattern is.
When does the Falling Three Methods Pattern appear?
Get the technical analysis of this pattern if:
- A stock or index is already going down for a while.
- There’s a short break in selling.
- The break includes small upward or sideways moves.
How to identify the Falling Three Methods pattern
- The overall direction must already be downward.
- It begins with a long red candlestick.
- The other three candles are small, green or sometimes neutral.
- The last candle breaks below the closing price of the first red candle.
What does the Falling Three Methods indicate?
If you see the Falling Three Methods pattern on a chart, it’s a clear signal of a downtrend. Even though a few small green candles may appear in the middle, they don’t mean a real reversal is coming. The final red candle confirms that sellers are still pushing stronger.
Is Falling Three Methods bullish or bearish?
This pattern is bearish through and through. It forms during a falling market. Even though you’ll notice a few small bullish or neutral candles, they’re weak and unable to push the price up.
Example of Falling Three Methods in a real chart
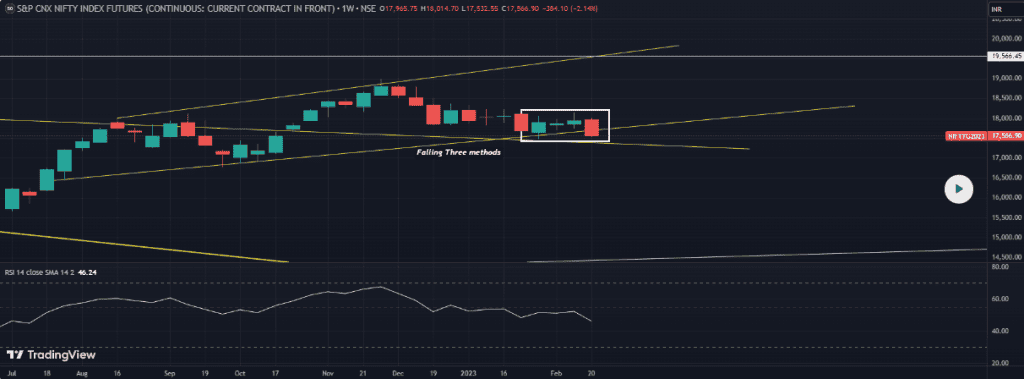
Let’s take the NIFTY FUTURE Index where the pattern started from 23 Jan 2023 and ended on 20 Feb 2023. The price was near a strong support zone around 17500–17600. If it breaks below this level, sellers may become even more aggressive. That could lead to pressure on call traders at 17500 and 17600, adding more downward momentum.
The next possible support is between 16800–17000.
How to trade using the Falling Three Methods pattern
Check for a big red candle, two to four small green candles inside the first candle’s range, and a second big red one that ends below the first one. Most traders sell right after the fifth candle closes.
Confirmation tools for Falling Three Methods (EMA, ADX, Volume)
- A 20 or 50 EMA sloping down strengthens the bearish pattern.
- ADX above 25 tells you that the trend is strong.
- Look for the body on the first and last red candles while weaker volume in the small middle candles.
Advantages of the Falling Three Methods pattern
- Know when sellers have come to do a trend reversal.
- Gives clear spots for entries and stop-losses.
- If used with indicators like EMA, ADX, or volume, traders can get stronger signals.
Limitations of the Falling Three Methods pattern
- It can mislead you if the market is moving sideways.
- If you are waiting for confirmation, you might enter late.
- If it looks perfect, the price may not fall further.
When the Falling Three Methods pattern may fail
- If the market isn’t already falling, this pattern might not mean anything.
- When the 3 small candles move outside the first candle’s high or low, the pattern is broken.
- The final red candle doesn’t fall below the first candle’s low.
Opposite pattern: rising three methods
The Rising Three Method means the uptrend might continue.
Start with a strong green candle.
- Followed by 3 small red or neutral candles staying inside that first candle.
- Then comes another strong green candle that gets closed above the previous one.
Related Candlestick Patterns
1. Bearish Flag
A Bearish Flag is a sharp drop that forms the flagpole. Then, prices move slightly upward or sideways, forming the flag. It means buyers are stepping in, but their move lacks strength.
2. Bearish Pennant
A bearish pennant has a fast fall in price, then a tight triangle, then another fall. It happens when the price falls fast and moves again in a small range.
3. Three Black Crows
Three black crows have three big red candles in a row: one opens inside the last candle and closes below it. Buyers try to take control each day, but sellers are too strong.
Conclusion
The Falling Three Methods shows up during a downward trend and signals that the price might fall even more after a short pause. Buyers enter for a short time but fail. Once the fifth candle closes, it’s a strong sign that the price could drop again.
FAQs
It shows that sellers are in control. After a sharp fall, buyers try to push prices up slightly for a few candles, but they fail. The final red candle confirms that selling pressure is back and the downtrend might continue.
It works well on 1-hour, 4-hour, or daily charts. These timeframes give clear signals of a downtrend and reduce false patterns. Lower timeframes like 5-minute charts may show this pattern often but with less accuracy.
It is a bearish pattern. It signals that the price may fall further. The buyers look active for a short time, but they lose control quickly. This shows strong selling pressure and trend continuation.
No, Falling Three Methods is not a reversal signal. It supports a continuing downtrend. It shows a pause where prices move slightly up and followed by another strong push down from sellers.
It’s fairly reliable in a strong downtrend, especially when backed by high volume and trend indicators. But in sideways markets, Falling Three Methods can mislead. Use it with moving averages or momentum tools to increase accuracy.
A falling window is a bearish gap pattern that appears when the current candle opens below the previous candle’s low, leaving a visible gap on the chart. It signals strong selling pressure and often acts as a resistance zone in future price movements.
The three red candles pattern usually refers to Three Black Crows, a bearish reversal pattern. It consists of three consecutive long bearish candles, each closing lower than the previous one. It indicates strong and sustained selling pressure.
The Falling Three Methods is a continuation pattern in a downtrend. It includes:
One long bearish candle.
Three small bullish candles that stay within the range of the first candle.
A final strong bearish candle that breaks below the previous low.
It signals a temporary pause before the downtrend resumes.
A bearish falling three methods pattern confirms continuation of a downtrend. After a brief consolidation (the three small candles), the final strong bearish candle shows that sellers have regained control, pushing the price lower.