Every trend includes phases of advance and retracement. Measuring them helps in identifying the price structure and gaining clarity. The Fibonacci retracement golden ratio, or 61.8% level, represents a key point that traders use to evaluate pullbacks. In this blog, we discuss its concept and how to interpret it in trading.
What is the Fibonacci retracement golden ratio?
The Fibonacci retracement golden ratio refers to the 61.8% level derived from the Fibonacci number sequence. This level is used in trading to estimate whether a correction is slowing down, pausing, or taking a reversal.
It is a technical analysis tool that plots percentage levels based on the distance between a significant swing high and swing low. The 61.8% is considered important because it represents a mathematical relationship repeatedly found in nature, geometry, and markets.
When prices pull back to this level, traders watch it closely. If the broader trend remains intact, this level becomes support in an uptrend and resistance in a downtrend.
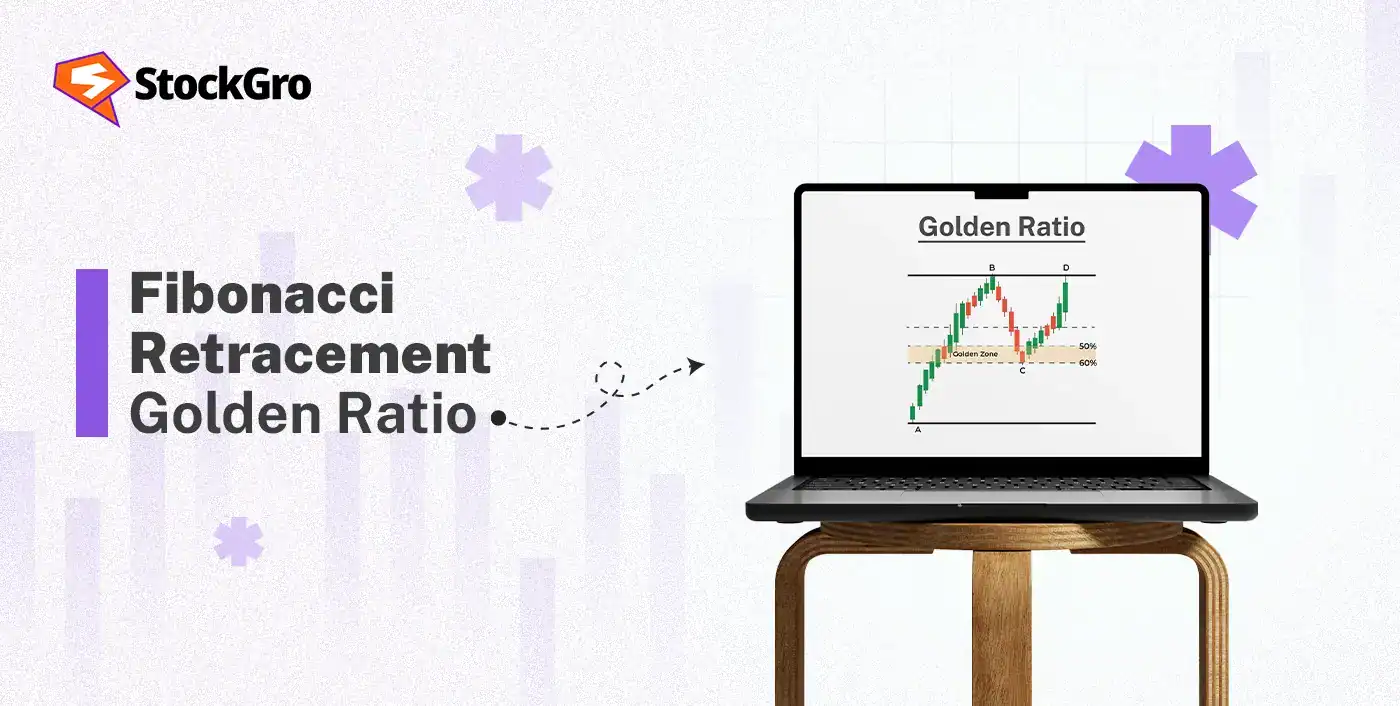
What is the “golden ratio” (1.618), and why do traders use 0.618 (61.8%)
The golden ratio appears when you divide a number in the Fibonacci sequence by the number before it until the value stabilises close to 1.618.
Traders use 0.618, which is the inverse of 1.618. The reason why traders use it is that this level reflects a deep but controlled correction in the market. It suggests that the trend may still be valid even after a significant pullback.
How 0.618 becomes the key retracement
When a strong move begins, momentum builds quickly. But no trend continues without pause. At some point, the price pulls back, and everyone begins monitoring the market reaction to decide their next move. This is where the 0.618 level begins to matter.
A shallow retracement may signal strong momentum, while an extremely deep one raises doubts about the trend. The 0.618 represents a correction that is significant enough to matter but not deep enough to destroy the trend structure.
Because this depth reflects a balance between fear and confidence, traders naturally focus on it. Over time, the shared attention turns 0.618 into a key retracement level.
The 61.8% retracement level: what it signals on price charts
The 61.8% level is a critical evaluation point on charts, helping traders assess the following:
- Key Evaluation Zone
The 61.8% highlights an important decision level at which every market participant evaluates their position. Price often slows down or consolidates here, making it a valuable point to observe the market before taking a trade position. - Support and Resistance
This level is also useful for identifying major support and resistance zones.- In an uptrend, a retracement toward 61.8% often attracts buying interest as this level acts as a support for the bullish structure.
- In a downtrend, a pullback to this level becomes resistance, inviting sellers and signalling bearish momentum.
- Continuation Confirmation
When price reacts strongly at the 61.8% level and aligns with supportive indicators, it strengthens the probability that the existing trend is preparing to resume. - Warning of Trend Shift
If the price makes a significant move beyond this ratio, it means that the trend is losing momentum and hints at a deeper correction or potential trend reversal.
When 61.8% works best
The Fibonacci retracement golden ratio works best when combined with clear trend analysis. Applying it randomly or in isolation can create false signals.
In an uptrend (pullback support zone)
In an uptrend, price forms higher highs and higher lows. During a pullback, the 61.8% acts as a support level where buyers reassess the price and step back into the market.
If the retracement aligns with the prior trend and is supported by bullish candles and high volume, the probability of the trend’s continuation increases. The level becomes more reliable when the trend structure remains intact.
In a downtrend (throwback resistance zone)
The price makes higher lows and lower highs in a downtrend. When price retraces upward toward the 61.8% level, it can act as a resistance at which sellers start to re-enter.
If the price rejects this level along with bearish candlesticks and weak momentum, it signals selling pressure. The setup becomes stronger when the overall trend is weak, and resistance is clearly visible.
How to draw Fibonacci retracement correctly
Drawing the price move with correct Fibonacci retracement settings is essential for accurate analysis. Misplaced swing points can lead to misleading levels.
Pick the correct swing high + swing low
The accuracy of Fibonacci retracement depends on selecting meaningful price swings.
A swing high should be a clear peak followed by a visible decline, and a swing low should show a strong upward bounce. Avoid small intraday fluctuations as they can distort the retracement structure.
Uptrend: swing low → swing high
Step 1: First, identify a strong upward move on the chart. Look for a clear swing low where the price begins rising with momentum.
Step 2: Track the move and locate the swing high where the price started to pull back.
Step 3: On your charting platform, select the Fibonacci retracement tool.
Step 4: Click on the swing low first, then drag the tool upward to the swing high. The direction matters here.
Step 5: Once plotted, observe the levels that appear below the high. Pay special attention to the 61.8% level, as this may act as a support zone during the pullback.
An uptrend was visible in Reliance’s share price in the first half of October, 2025.
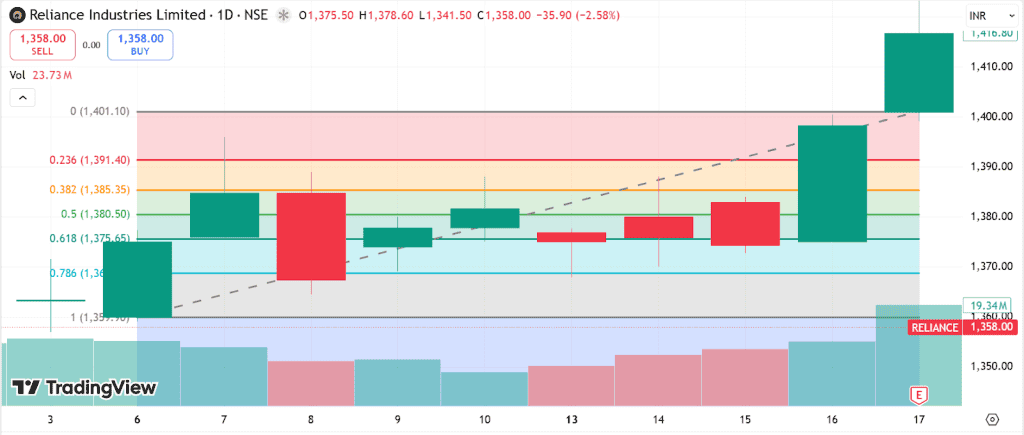
- The swing low was at ₹1,359 on October 6, 2025. Over the next two weeks, it rose to reach over ₹1,400.
- The price stayed in a consolidation phase near the 0.618 level at ₹1,375.
- This level acted as support before the price broke out into a strong bullish move.
Downtrend: swing high → swing low
Step 1: Begin by identifying a strong downward move where the price shifted from an upward movement to a decline.
Step 2: Locate the swing high, then find the swing low where the price paused or tried to bounce.
Step 3: Pick the Fibonacci retracement technical tool on your chart’s dashboard.
Step 4: Click on the swing high, then drag the tool to the swing low. Make sure you’re drawing in a downward direction.
Step 5: Observe the retracement levels plotted above the low. The 61.8% level often acts as resistance if the broader downtrend remains intact.
Here’s HDFC Bank’s chart with a Fibonacci retracement in a downtrend:
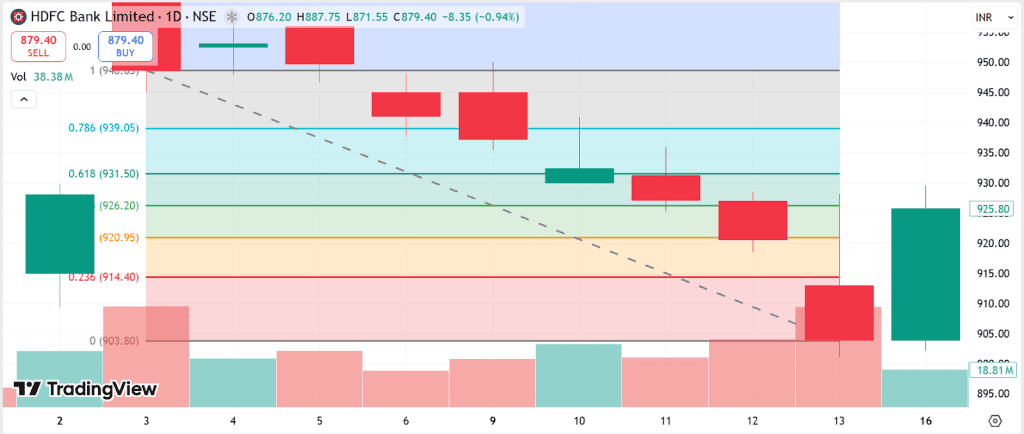
- The chart shows a downward move starting on February 3, 2026, at ₹948. The price had fallen close to ₹905 on February 13, 2026.
- The price tried to jump back from ₹931, the 0.618 resistance area.
- The bounce back did not sustain, and the downtrend continued.
61.8 “golden zone” vs other key levels (38.2 / 50 / 78.6)
While 61.8% is considered the golden ratio level, other retracement levels also provide useful information.
- 38.2% represents a shallow to moderate correction. It reflects a very strong trend and usually occurs in high-momentum markets.
- 50% is actually not a Fibonacci number, but is still popularly used because it signifies an equilibrium in the market where both buyers and sellers are competing to take control.
- Golden Zone (50% – 61.8%): The area between 50% and the Golden ratio is known as the golden zone. It is a common area used to look for high probability trades.
- 78.6% is the last breaking point of a pullback. If the price moves beyond this level, the probability of a full reversal magnifies.
Conclusion
The Fibonacci retracement golden ratio represents the 61.8% retracement level derived from the mathematical golden ratio of 1.618. In trading, this ratio is used to identify the depth of a pullback in an ongoing trend.
However, it is not a standalone tool. It should be combined with volume and confirmation signals for better accuracy. When used properly, the golden ratio can bring structure to price corrections and improve decision-making.
FAQs
The golden ratio in Fibonacci retracement refers to the 61.8 percent level derived from the mathematical ratio of 1.618. It is used to identify potential pullback zones.
It is called the golden ratio level because 61.8% is the inverse of 1.618, a key mathematical ratio observed in the Fibonacci sequence and widely applied in technical analysis.
The 61.8 percent level is often considered the strongest because it represents a deep yet controlled level of correction. However, its strength depends on context and confirmation.
No, 50% is not a Fibonacci retracement level because it is not derived from the Fibonacci sequence, but it is widely used by traders as markets often retrace before a price move.
In an uptrend, draw from the swing low to the swing high. In a downtrend, draw from the swing high to the swing low. Use clear, significant points for accuracy.